Saad Ullah

Oracle's stock has been bleeding for months, and every attempt at a bounce has fizzled out. In the latest session, shares dropped another 7.5% to around $254, extending a pattern of lower highs and lower lows that started back in mid-summer.
Technical Picture: Trapped in a Descending Channel
Technical analyst Rocky - The Stock Trader Hub highlights that Oracle is now trading inside an earnings gap heading toward $240, and with momentum indicators still pointing down, there's real risk of more pain ahead.
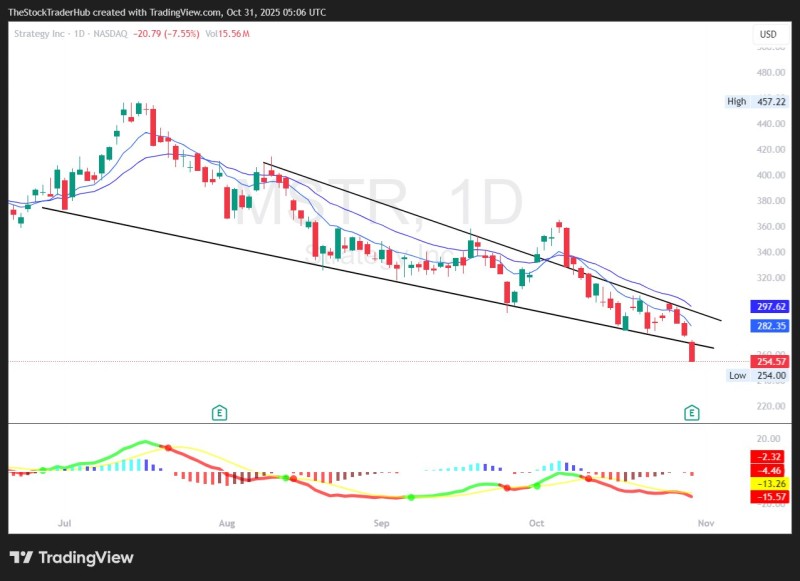
The daily chart tells a clear story: Oracle is trapped in a descending channel—a textbook sign of a sustained correction. The upper resistance line runs from July's peak near $457 down through failed rally attempts around $300–$320, while the lower boundary sits right where the stock is now testing support at $254.
Here's what stands out technically:
- Moving Averages: Oracle is trading below both key short-term averages (at $297.6 and $282.3), which are sloping downward and acting as resistance
- Earnings Gap: There's an unfilled gap between $260 and $240 from the post-earnings drop—stocks often revisit these gaps, and Oracle seems headed that way
- MACD Indicator: Firmly bearish, with both signal lines underwater and widening—momentum is still favoring sellers
- Channel Support: The current $254 level marks the lower edge of the descending channel, making it a critical make-or-break zone
Broader Market Context: Tech Sector Weakness
Oracle's troubles aren't happening in a vacuum. The broader tech sector has been choppy, and investors reacted coolly to the company's last earnings report—cloud revenue looked decent, but growth in core enterprise segments slowed. Add in fading AI hype and rising bond yields, and large-cap tech names like Oracle are feeling the squeeze. The stock's lagging performance compared to peers like Microsoft and Amazon has only deepened skepticism about its near-term outlook.
Looking ahead, if Oracle can't hold around $254, the next stop is likely $240—the gap-fill zone and a psychological support level. Below that? We could see $225, where the stock consolidated back in early 2023. On the flip side, a recovery above $260 would be the first real sign of stabilization and might spark a relief rally toward $282–$297. But for now, the chart stays bearish until we see a confirmed higher low.
Oracle's slide into the $240 earnings gap might not be the end of the story—indicators suggest more downside could be coming before any real recovery takes hold. The $240–$260 range is where things get decided: either Oracle finds its footing, or it slips deeper into correction territory.
 Saad Ullah