 Marina Lyubimova

Nvidia just did something important. The stock closed right at a resistance zone that's been holding it back, and now everyone's watching to see if it finally breaks through.
What's Happening on the Chart
Trader @yasutaketin pointed out that NVDA is attempting a breakout while bears who went short might be sweating. This isn't just another chart pattern - it's a test of whether the AI rally still has legs.
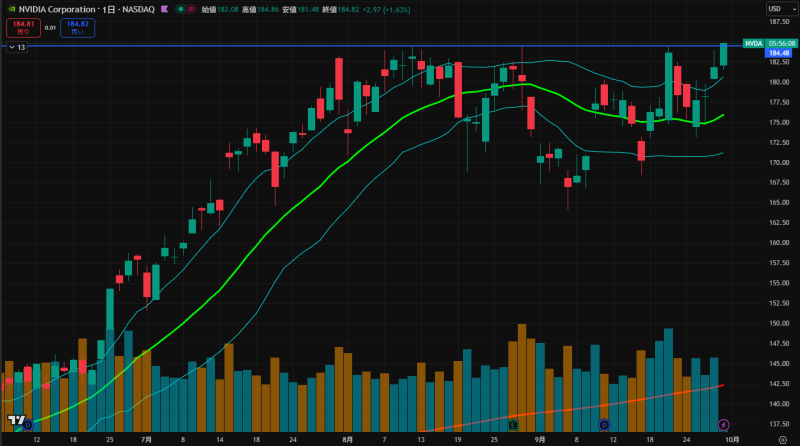
NVDA finished at $184.82, basically sitting on top of the $184.48 resistance shelf. Since early September, the stock has been forming higher lows in a tightening pattern that screams "breakout coming." The upper Bollinger Band is getting tested while the bands themselves are widening out, which usually means bigger moves are ahead. The 20-day moving average has curved upward underneath price, confirming the bullish structure. And volume? It's picking up at exactly the right time.
The Levels That Matter
Here's what traders are watching: immediate resistance sits at $184.5, with first targets at $187.5 if it breaks, then the psychological $190-$200 zone after that. On the downside, support holds at $181-182 for now, with backup at $177-178 where the 20-day average lives, and a deeper floor around $171-172 from the September base.
The AI story hasn't gone away - Nvidia's chips are still the backbone of every major data center buildout. Big tech is leading again, and risk appetite is back. The main threats? Rising bond yields or surprise regulatory moves, but neither has derailed things yet.
 Marina Lyubimova


