 Marina Lyubimova

Nvidia isn't just another tech stock right now - it's the canary in the coal mine for the entire market. Trading at $181.85 and pressing against the $184.50 ceiling, the chip giant is setting up for a move that could ripple across Wall Street.
The Technical Picture
As TrendSpider pointed out, this isn't subtle: "where NVDA goes, the market will follow." The daily chart tells a clear story. Nvidia's carved out a textbook ascending triangle, with support climbing steadily near $175 while resistance holds firm at $184.50. This isn't the first time price has tested this ceiling - it's been rejected here multiple times in recent months. But each bounce finds a higher low, showing buyers are getting more aggressive. That kind of coiling pattern usually doesn't end quietly.
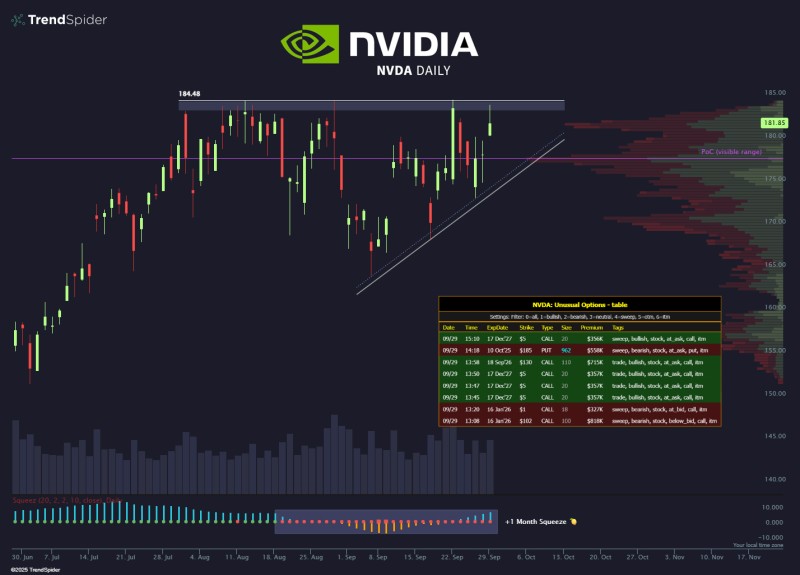
The stock's sitting just 1.5% below the breakout zone. If it punches through $184.50 with conviction, the technical setup points to a fast move higher, potentially targeting $190 and then $200.
The options market is lighting up with bullish bets:
- Large call sweeps clustering at $185 and above - smart money positioning for upside
- Deep out-of-the-money calls with longer expiries - traders expecting a sustained rally over the next few months
- Put activity remains light - bearish hedges are scarce compared to bullish flows
This institutional positioning adds serious weight to the technical setup. When big players start loading up on calls while volatility is compressed, they're usually expecting something to break loose.
Why This Matters Beyond Nvidia
Nvidia's become more than a semiconductor play - it's the proxy for AI hype, tech sector health, and risk appetite in growth stocks. The company's dominance in GPUs for AI workloads means its stock moves can swing sentiment across the entire tech universe.
Adding intrigue is the "1-Month Squeeze" signal flashing on the chart. Compressed volatility like this often precedes explosive moves in either direction. The question isn't whether something big happens - it's which way it breaks. With Fed policy uncertainty and Treasury yield swings still rattling markets, a false breakout can't be ruled out. But right now, the setup leans bullish.
Resistance sits at $184.50 - that's the line in the sand. Break it, and momentum traders will pile in. Support holds at $175, backed by both the rising trendline and point of control from recent volume. If buyers fail here, expect a drift back toward that support zone before the next attempt.
 Marina Lyubimova


