 Saad Ullah
⬤ Nvidia (NVDA) is showing signs it might be done falling for now. The stock just formed what traders call a bullish hammer candle on the daily chart—basically a sign that sellers tried to push it lower but buyers stepped in. Right now, it's holding steady around $171, which lines up perfectly with both a Fibonacci support level and a spot where lots of previous trading happened. When you see price action like this, it usually means the selling pressure is running out of steam.
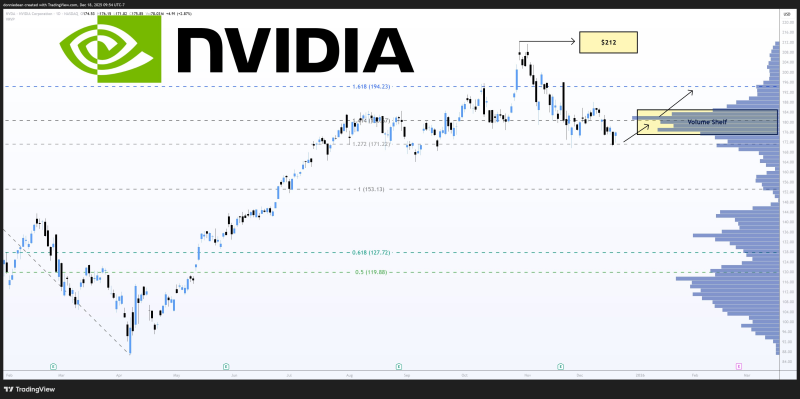
⬤ The $170 to $175 range is turning out to be pretty important. If you look at the volume profile, there's a thick shelf of trading activity right here—think of it as a zone where investors were actively buying shares in the past. When a stock comes back to these areas, those same buyers often show up again. The fact that NVDA isn't breaking through to the downside suggests there's real demand holding it up.
NVDA is finding support near the $171 level, which aligns closely with a key Fibonacci retracement and a visible volume shelf.
⬤ Looking up from here, traders are watching $194 as the next realistic target. That level hits the 1.618 Fibonacci extension—the golden ratio that technical analysts love—and it's sitting right where previous resistance showed up. If the stock can break through there with some conviction, the next stop could be around $212, which would put it back near recent highs. Of course, all of this depends on whether NVDA can actually hold this $171 support zone.
⬤ This setup matters more than usual because Nvidia isn't just any stock—it moves the whole semiconductor sector and carries serious weight in major indexes. When a high-profile name like this shows clear support and resistance levels, institutional traders pay attention. The next few trading sessions will tell us whether this is just a pause before more downside or the beginning of a real bounce back up.
 Saad Ullah


