 Marina Lyubimova

⬤ Nvidia's share price appears to be steadying after its recent slide. The rebound is starting from a price level that has already produced multiple bounces - yet the quote remains under its long term average. Analysts are watching the 325-day simple moving average, now near $183, as the next likely destination if the climb continues.
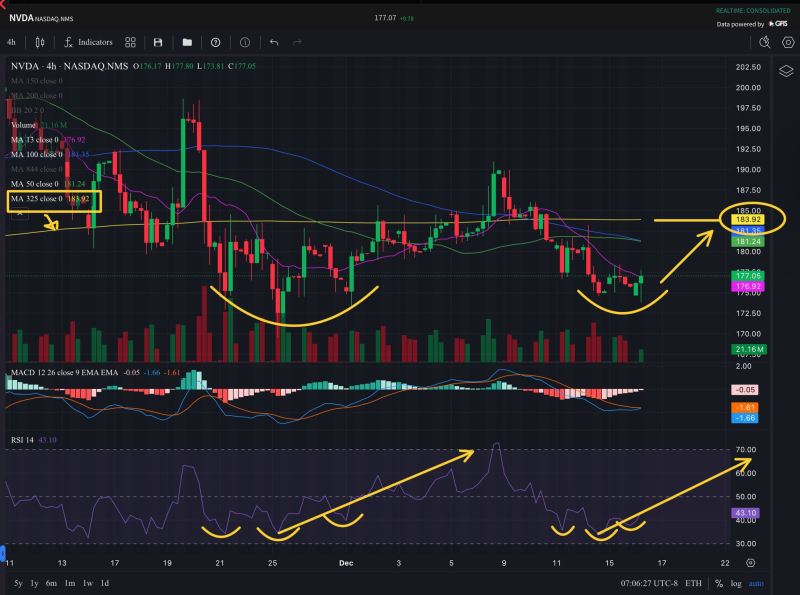
⬤ The price trace is drawing a possible double bottom - two separate sell offs have stopped at almost the same support point and the gentle curve upward implies that downward pressure is weakening. The $183 figure is not arbitrary - it coincides with the Banana325SMA, a line that has served as a dependable reference on this chart and that overlaps earlier resistance peaks.
NVDA is lifting from an area that has repeatedly produced rebounds - the 325-day average around $183 is becoming the next upside landmark.
⬤ Momentum gauges are also turning more constructive. The RSI has returned to the oversold region that has previously marked turning points, while the MACD is nearing a bullish crossover, an event that has matched prior rallies in this time frame. The outline of the price action even hints at an inverted head-and-shoulders reinforcing the rebound case.
⬤ The importance of this picture rests on Nvidia's weight in the semiconductor group. How the price behaves around the $183 average should decide the next leg. A sustained push that stays above that line and gathers strength would open room for a wider recovery - failure to retake the level would leave the shares in their corrective phase for an extended period.
 Marina Lyubimova


