 Usman Salis

⬤ Nvidia stock is trading at a technically important spot, with NVDA consolidating near a clearly defined support zone on the weekly timeframe. After a strong rally and mid-cycle pullback earlier in 2025, price has stabilized in the $185–$190 area. The chart shows NVDA maintaining higher lows and avoiding a decisive breakdown, signaling the broader bullish structure stays intact for now.
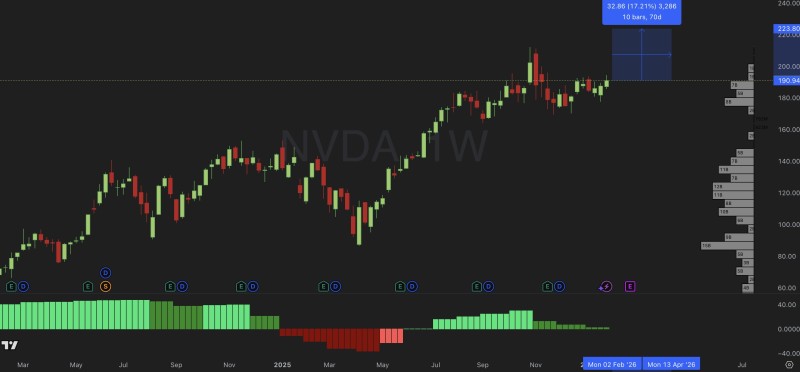
⬤ The current month is critical for NVDA's trend outlook. The chart highlights that support must keep holding while the Monthly BX indicator remains positive. Right now, the Monthly BX is still green, pointing to trend continuation rather than a confirmed cycle top. Recent candles show consolidation instead of distribution, with price reacting constructively above support rather than accelerating lower.
⬤ From a structural view, the weekly chart outlines a potential upside path if current conditions hold. A measured move points toward the $220 area in the April to May window, depending on support holding and momentum staying constructive. The analysis also emphasizes risk symmetry—failure to hold current support would mark a meaningful structural shift and raise the probability that the broader bull cycle has topped. For now, neither price action nor momentum indicators confirm such a breakdown.
⬤ This setup matters for overall market conditions since Nvidia has been central to driving sentiment across the semiconductor and AI space. Continued stability in NVDA supports confidence in the broader growth story, while a structural failure would likely pressure related sectors. With price compressing above support and momentum still constructive, the coming weeks will define whether NVDA extends its bull cycle or transitions into a longer-term structural reset.
 Usman Salis


