 Marina Lyubimova

⬤ NIO Inc. (NIO) is drawing fresh bullish attention as the daily chart shows price holding around $4.93, a level marked as the 0.618 Fibonacci retracement. The bias is turning more bullish on NIO, though nervousness remains ahead of earnings. The setup highlights a tight decision zone where catalysts could drive a larger move.
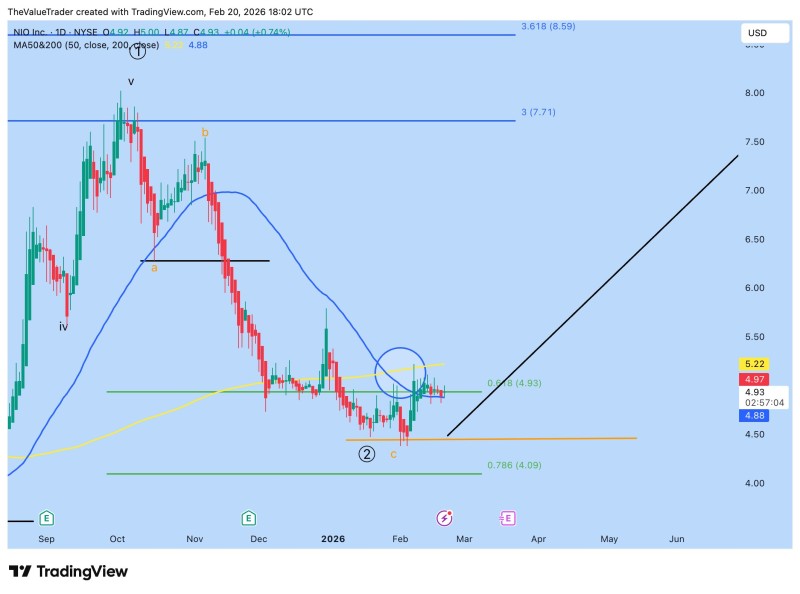
⬤ Technically, NIO is reacting to a cluster of critical levels. The 50-day moving average sits near $5.22, while the 200-day moving average rests around $4.88, placing price between the two trend gauges. The chart also marks deeper support at the 0.786 Fibonacci level around $4.09, with additional horizontal support near the mid-$4.50 area.
⬤ On the upside, projections point toward higher resistance zones, with Fibonacci extension levels labeled near $7.71 and $8.59. That upside path depends on whether NIO can maintain traction above the $4.90 to $5.00 area and reclaim the region around the 50-day moving average. Similar technical framing has appeared in recent coverage, including NIO Targets $8.20 as Weekly Base Forms, Can $4.90 Support Hold as Shares Test Critical Moving Averages?.
⬤ Earnings are the key near-term risk factor because they can validate or break the developing base structure. If the stock slips back under the $4.88 to $4.93 area, attention could return to lower support zones such as $4.50 and the $4.09 retracement level. If the current pivot holds and momentum builds, the chart's marked targets above $7.70 become the next reference points for market direction.
 Marina Lyubimova


