 Artem Voloskovets

⬤ NIO Inc. (NIO) is trying to find its footing after a prolonged selloff, now trading in the $4.80–$5.15 range where the 50-day and 200-day moving averages intersect. Reclaiming both moving averages would signal a bullish shift—though that hasn't happened yet. The stock is holding just above the $4.90 support zone, which lines up with a major Fibonacci retracement level identified on the chart.
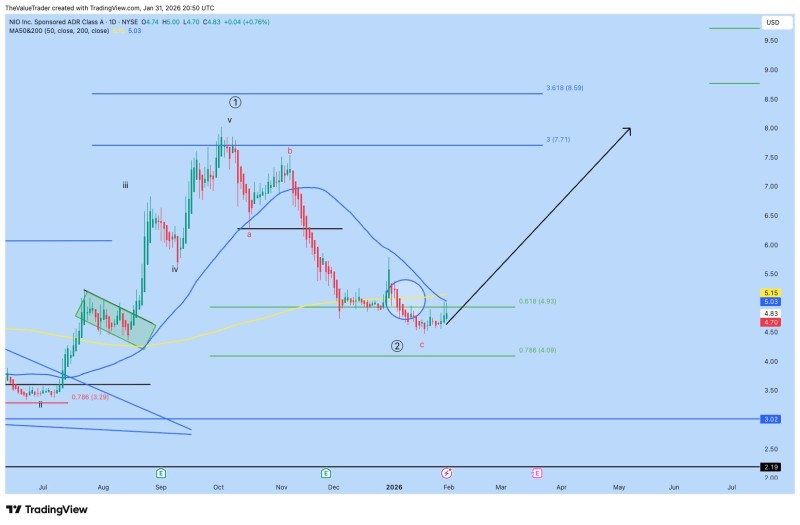
⬤ After tumbling from around $7.70, NIO has shifted into sideways consolidation, suggesting sellers may be losing steam. The 50-day moving average has flattened out while the 200-day remains overhead, creating what traders see as a critical decision point. Price is compressing below resistance, a pattern often watched for a directional move.
⬤ NIO has struggled to break above these moving averages recently, which makes a potential reclaim worth watching. The chart doesn't confirm a breakout yet, but the setup is there. As one analyst noted, "A catalyst is still required, with upcoming earnings identified as a possible trigger rather than a guaranteed driver of upside."
⬤ If NIO can push above both moving averages, it would mark the first real improvement in medium-term market structure after months of weakness. Until then, the stock remains in limbo—caught between technical resistance and support—with earnings serving as the next potential spark.
 Artem Voloskovets


