 Usman Salis

⬤ NIO stock has entered a technically important phase as it trades around its 20-month simple moving average after a significant shift in price structure. The shares recently pushed back above this long-term indicator, which had been acting as resistance. The monthly chart reveals this move happened with strong trading volume, showing solid participation during the initial breakout.
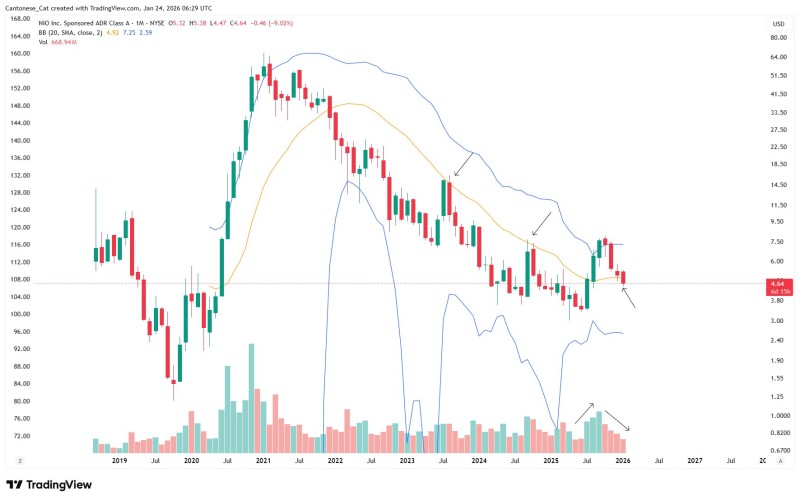
⬤ After breaking above the 20-month SMA, NIO pulled back to test the same level from above. This retest came on noticeably lighter volume, suggesting selling pressure was weaker than the buying that drove the earlier advance. Recent price action shows the stock stabilizing near the moving average instead of rallying sharply higher, pointing to a consolidation phase rather than an immediate trend continuation.
⬤ Looking at the bigger picture, the chart shows a long decline from NIO's earlier peak, with the 20-month SMA consistently acting as resistance during that downtrend. The recent move above this level could signal a structural shift, though confirmation is still pending. The moving average now sits right in the middle of the current trading range, making it a key reference point for whether the stock can maintain its recent gains.

⬤ This setup matters because long-term moving averages often serve as trend validators. If NIO can hold monthly closes above the 20-month SMA, it would strengthen the case for a developing recovery. Failure to hold this level would suggest the recent move might just be a correction within the larger downtrend. As NIO trades near this technical boundary, the next few price moves will likely shape how traders view the stock's medium-term direction.
 Usman Salis


