 Usman Salis

⬤ NIO sits around $5.10 right now, pulling back into a technical zone that's getting attention on the long-term charts. Traders are watching whether the stock can work its way back to $16 by 2026. The chart shows a wide rounding pattern stretching into the next couple years, hinting at a gradual recovery scenario.
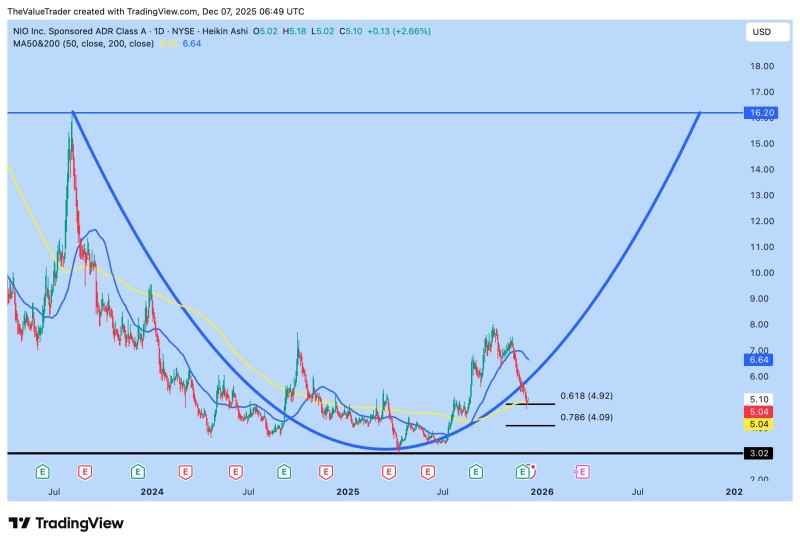
⬤ Two Fibonacci levels stand out here: the 0.618 zone at $4.92 and the deeper 0.786 level at $4.09. These spots typically act as support during pullbacks. The 50-day moving average is sitting near $5.04, right where the current dip is happening, while the 200-day MA is higher at $6.64, reflecting the downtrend that dominated most of 2024. Looking at the left side of the chart, you can see the decline followed by base-building that forms the bottom of this projected recovery arc.
⬤ The long-term path sketched out suggests a steady climb through 2025 into 2026, aiming for the $16.20 area. This is more about cyclical recovery than quick moves. The curved trajectory mirrors past consolidation periods that led to upward attempts, giving context for how NIO has traded through similar phases before.
⬤ Why it matters: these long-range patterns influence how the market reads momentum and values the stock. The combination of Fibonacci levels, moving averages, and the rounded base creates a roadmap that could help set expectations as NIO moves through this multi-year cycle.
 Usman Salis


