 Usman Salis

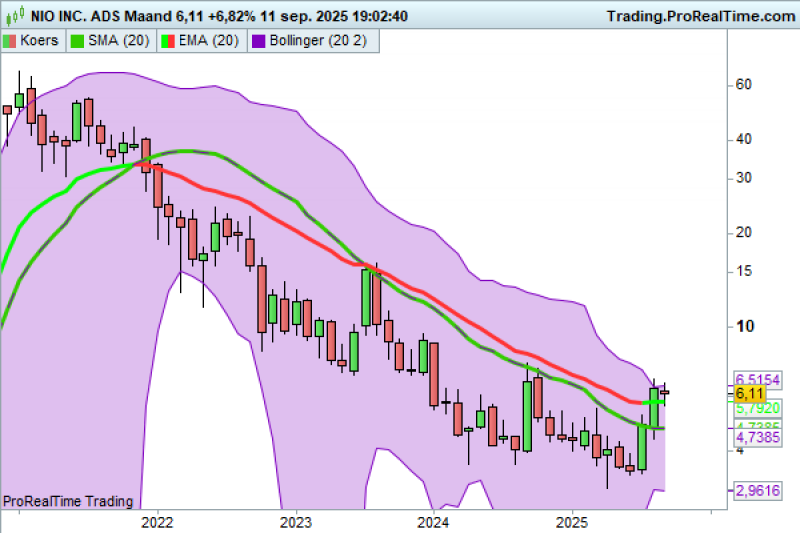
Chinese electric vehicle maker NIO has delivered its strongest technical signal in years, with shares jumping 6.8% to $6.11 and breaking above critical moving averages. This breakout comes just one day after a 9% selloff triggered by dilution fears, suggesting the market is prioritizing technical momentum over short-term headline risks.
NIO Surges Despite Dilution Concerns
After enduring months of bearish pressure, NIO is showing its first meaningful technical reversal in years. Yesterday's news about potential share dilution sparked a 9% decline, but the market quickly shrugged off these concerns. As trader JDB observed, investors are now focusing on chart patterns rather than noise.
Today's 7% recovery confirms this shift in market sentiment and highlights the stock's resilience at current levels.
Chart Analysis: Breaking Above Key Averages
The monthly chart reveals a potential inflection point with several encouraging developments:
- EMA/SMA 20 Breakout – NIO has pushed above both the 20-period EMA (red line) and SMA (green line), creating a bullish crossover that often signals trend changes
- Bollinger Band Resistance – The stock is now testing the upper Bollinger Band near $6.50, where a clean break would confirm strengthening momentum
- Volume and Momentum Shift – After an extended downtrend, recent green candles indicate growing buyer interest and early institutional accumulation
These technical indicators support the bullish thesis that if NIO clears the Bollinger Band resistance level, significant upside momentum could follow.
Investment Implications
NIO has struggled through years of declining prices, facing intense competition in the EV space and persistent investor skepticism about Chinese stocks. However, with trading volume increasing and multiple technical signals aligning positively, the setup is attracting renewed attention from momentum traders.
If the stock maintains its position above $6.11 and successfully breaks through the $6.50 resistance zone, it could target the $7.90–$8.00 range where previous consolidation patterns formed. This represents meaningful upside potential for a stock that has been in decline for an extended period.
 Usman Salis


