 Saad Ullah

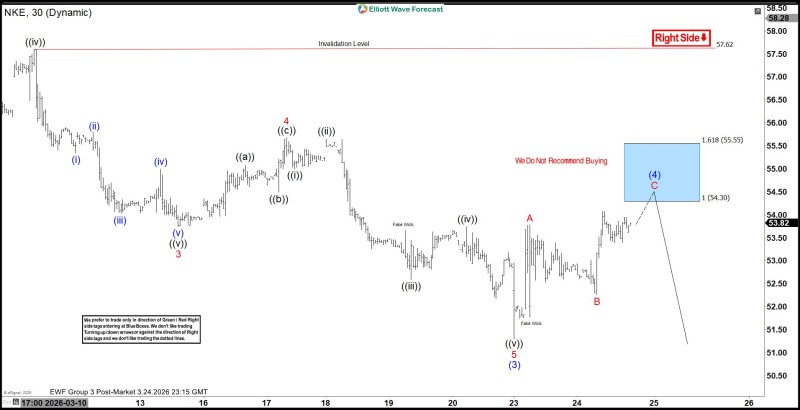
Nike is showing signs of recovery after recent weakness, but the broader structure suggests caution rather than confirmation of a new uptrend. As Elliottwave Forecast noted, the current move is unfolding as an A-B-C corrective rally within a larger bearish sequence, not impulsive strength. The distinction matters - what looks like a recovery may simply be a temporary bounce before the dominant trend resumes.
Nike Stock Bounce Fits a Classic Corrective Pattern
The chart outlines a clear sequence where Nike stock has transitioned into a short-term rebound following a prolonged decline. This rebound is labeled as an A-B-C structure, indicating a three-wave corrective move rather than the beginning of a sustained bullish trend.
The move higher exists, but it is classified as part of a correction, not a breakout.
Price is currently pushing higher within this corrective phase, moving toward a highlighted "blue box" zone - the expected termination region for the rally, where the corrective structure may complete. The framing is deliberate and precise.
The $54.30–$55.55 Zone Where Nike Momentum May Stall
The chart highlights a target region roughly between $54.30 and $55.55, marked as the blue box. This zone aligns with the projected completion of wave (4) within the broader sequence - a technically significant area where selling pressure has historically tended to reassert itself.
Importantly, the analysis explicitly notes "We Do Not Recommend Buying," reinforcing that the rally is not being treated as an opportunity to chase upside momentum. Instead, it is viewed as a temporary move within a larger bearish framework.
Corrective rallies often terminate near predefined zones before the broader trend resumes.
This reflects a core principle in Nike stock technical analysis: even when price is moving higher, the structure behind that move determines whether it represents genuine accumulation or simply a relief bounce.
Nike Stock Bearish Cycle Remains the Dominant Framework
Despite the ongoing rebound, the dominant interpretation remains unchanged. The entire move is labeled as part of a larger bearish sequence within a grand super cycle correction - meaning the current strength does not invalidate the broader downtrend. It fits within it.
Even in cases where bullish formations appear, they require confirmation. As covered in Nike stock forms double bottom: $74 target in sight, resistance breaks are necessary before any formation signals a true reversal - and that bar has not been cleared.
The rally is active, the target zone is approaching, and the broader trend context suggests that what looks like strength may ultimately resolve as part of a continuing corrective cycle.
 Saad Ullah


