 Marina Lyubimova
⬤ MSFT triggered a fresh sell signal on the weekly SuperTrend indicator, signaling a potential momentum shift after a strong rally. The indicator turned bearish as MSFT retreated toward $474, with the recent weekly candle dropping below the SuperTrend band following a sharp reversal from highs above $560.
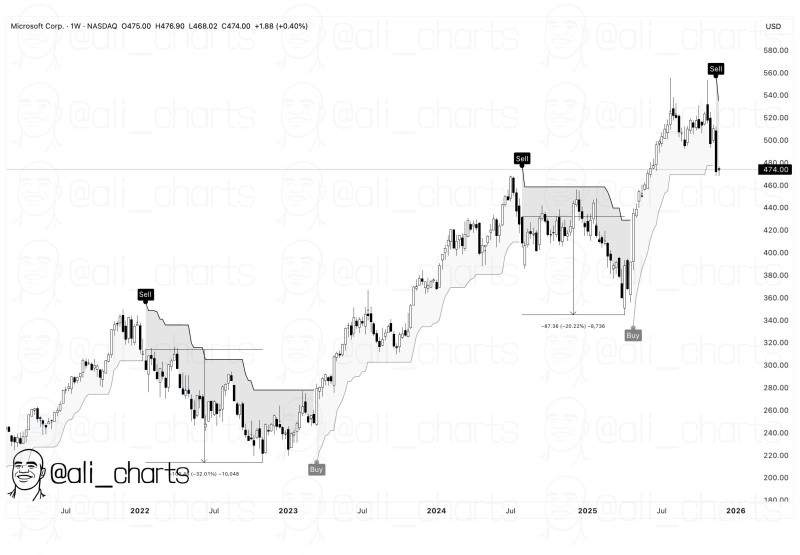
⬤ Historical data shows earlier SuperTrend sell signals preceded significant corrections. The mid-2022 signal was followed by roughly a 32% decline, while the early 2024 signal led to about a 20% drop before a new buy signal emerged. These cycles demonstrate how MSFT typically enters extended downtrends once the SuperTrend turns negative.
⬤ The current pattern mirrors previous setups, with MSFT breaking below SuperTrend support after pulling back from recent peaks. The latest weekly candle trades in the $468-$476 range. A buy signal earlier in 2025 fueled the strong advance before this recent shift, and the newly placed sell marker highlights the transition as the SuperTrend cloud tilts downward.
⬤ Weekly SuperTrend reversals on major tech stocks like MSFT often impact broader market sentiment, particularly when past signals aligned with extended pullbacks. With Microsoft showing its first weekly sell signal since early 2024 and price moving decisively off major highs, the momentum shift may spark renewed caution in tech. The next few weekly sessions will determine whether this signals a broader trend reversal or simply range consolidation.
 Marina Lyubimova


