Saad Ullah

⬤ Microsoft's stock is showing renewed upward momentum after bouncing from a key support zone identified by Elliott Wave analysts. MSFT moved sharply higher from the highlighted blue box region, which typically marks an area where buyers re-enter the market. The chart suggests Microsoft is maintaining its broader bullish sequence, staying above previously noted invalidation levels.
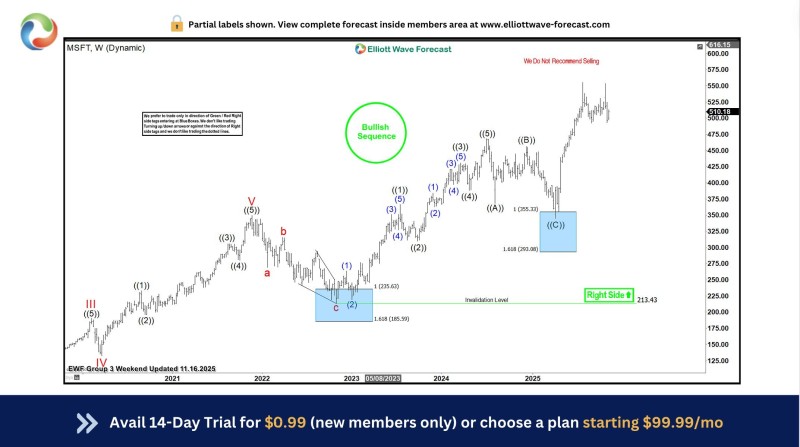
⬤ The chart shows Microsoft recently completed a corrective wave structure before accelerating upward, with the blue box area between earlier wave counts signaling a potential reversal point. This region was associated with a retracement targeting the 1.618 Fibonacci zone, where analysts typically expect bullish reactions. MSFT has since moved higher toward the $510 area, continuing the long-term uptrend shown across multiple weekly cycles. The upward reaction aligns with the larger impulsive pattern that's guided Microsoft's trend since late 2023.
⬤ The broader pattern also shows a clear right-side tag, indicating the dominant market bias remains upward within the Elliott Wave framework. The chart includes a note stating that selling is not recommended, highlighting that MSFT remains positioned within a bullish structural environment. The sequence of higher highs and higher lows across the wave count further supports the view that Microsoft is still tracking upward momentum despite recent corrections.
⬤ This matters because MSFT continues to be a key driver of strength in the technology sector, and its renewed upward structure reinforces confidence across the broader market. The strong reaction from a well-defined support area suggests sustained demand even after corrective movements, showing the resilience of Microsoft's long-term trend. With the bullish sequence intact, MSFT's performance may continue influencing expectations for the tech sector and broader market sentiment in the coming weeks.
 Saad Ullah