 Saad Ullah

⬤ Microsoft is nearing an important weekly support area that's been tested multiple times over the past few years. The stock has pulled back from recent highs and is now approaching a demand zone around $450 to $470, where price has historically shown strong reactions. This level, first highlighted in November 2025, could determine MSFT's next directional move.
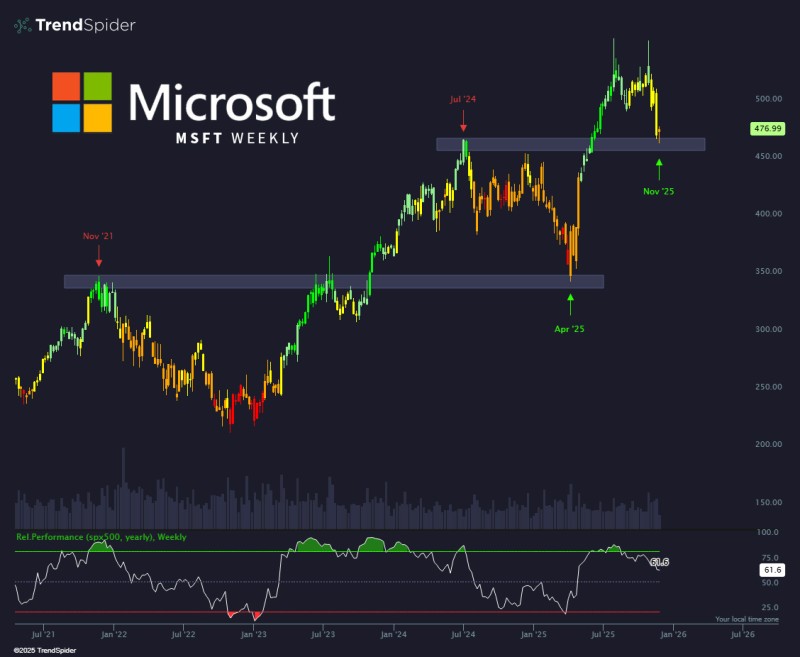
⬤ The weekly chart shows several pivotal zones that shaped Microsoft's path. A major resistance area from November 2021 later became a structural marker, while another key level from July 2024 marked the upper boundary before a sharp decline into April 2025's low. From that bottom, MSFT rallied strongly back toward 2024 highs before the current pullback. The RSI indicator sits in the low 60s, showing moderated momentum after the powerful rebound from April's lows.
⬤ This setup matters beyond Microsoft itself. As a heavyweight in major U.S. indices, how MSFT handles this support zone could influence the entire tech sector and broader market direction. The pattern of pullbacks into support followed by renewed upward moves has played out repeatedly at these multi-year levels, making this test particularly significant for traders watching large-cap tech sentiment.
 Saad Ullah


