 Usman Salis

⬤ Microsoft is back at a price zone that's triggered similar technical setups in the past. The stock is currently trading around $474, consolidating near a horizontal level that's worked as a pivot point before. This area has historically seen a pattern play out: price breaks resistance, pulls back to test that same level, then pushes higher. Right now, MSFT looks like it might be setting up for another round of that same sequence.
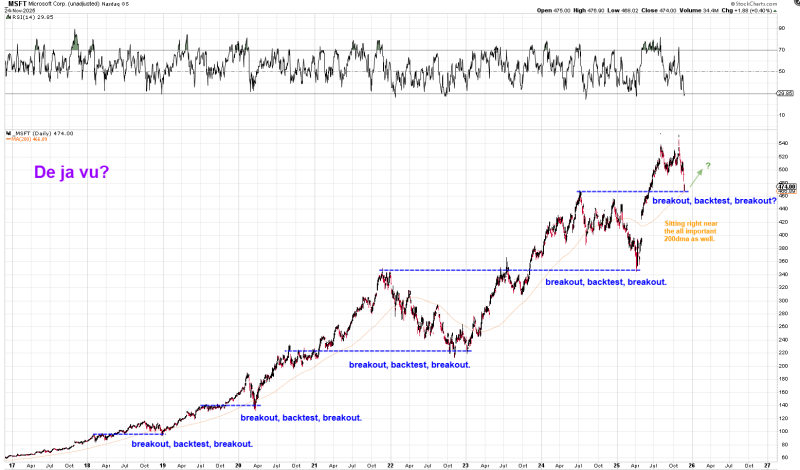
⬤ The chart shows this exact pattern unfolding multiple times over the years—around 2018, 2020, and 2022. Each time, Microsoft cleared a resistance zone, came back to confirm it as support, and then rallied. The current setup shows the stock pulling back from recent highs but holding steady near a key support band. What makes this interesting is that price is sitting right near the 200-day moving average, a trend line that's lined up with momentum shifts during those earlier cycles.
⬤ There's a tentative projection on the chart suggesting another leg up could happen if this support zone holds. The setup isn't perfect—there's some choppy price action as Microsoft consolidates—but the core pattern still matches what we've seen before. The RSI indicator at the top shows momentum cooling off after hitting elevated levels earlier this year, which fits with a healthy pullback before the next potential move.
⬤ This matters beyond just Microsoft's chart. As one of the biggest names in tech, MSFT's technical behavior often influences sentiment across the entire growth stock sector. When the stock approaches zones that have shaped previous trend continuations, traders pay attention. If this support level holds and the pattern repeats, it could signal broader strength in tech. If it breaks, it might shift directional bias across growth equities. The fact that this same structure keeps showing up at long-term support areas tells you where market participants are watching most closely.
 Usman Salis


