Artem Voloskovets

⬤ Microsoft stock is climbing after a solid rebound from the blue box support cluster shown on the Elliott Wave chart. MSFT showed an impressive reaction higher, boosting the upward momentum that's been driving its long-term trend. The weekly chart shows that price held firm near the $355 correction zone and quickly turned higher, signaling the trend is continuing as expected within the broader bullish sequence.
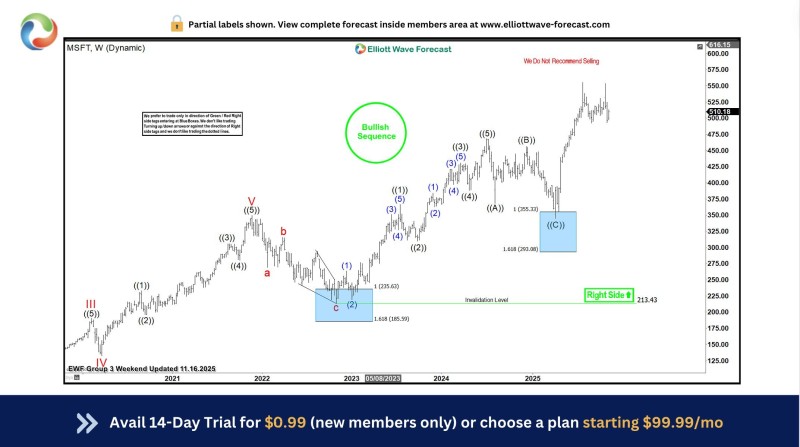
⬤ The chart maps out a multi-year Elliott Wave pattern, starting with a completed impulse cycle around late 2021 followed by an extended pullback. The blue box zone, placed between the 1.0 and 1.618 Fibonacci extensions around $293-$355, marked where wave ((C)) was expected to finish. MSFT bounced strongly from this area, similar to the earlier structure where wave ((2)) ended near $235 before the stock advanced in a sustained move. Multiple internal wave counts are marked throughout the chart, showing previous five-wave completions, pullbacks and continuation phases that illustrate how the trend has been unfolding. The "Bullish Sequence" label emphasizes that the upward structure is still in control.
⬤ The chart also shows an invalidation level near $213.43, which sits well below current price action, giving plenty of room for the bullish outlook to play out. Recent candles show the continued advance, with MSFT trading above $500 after accelerating from the blue box and holding comfortably above all major support levels. The Elliott Wave patterns on both earlier and recent corrections show the similarity in the overall structure, with each major pullback resolving into a new upward leg. The latest bounce confirms that the stock has resumed its upward path after finishing a corrective phase.
⬤ This strong reaction from the projected support area matters because it lines up the long-term technical pattern with renewed momentum in large-cap technology stocks. Microsoft's ability to hold at the expected completion zone of its corrective structure gives more confidence to the bullish view of the trend. With MSFT continuing to trade near its all-time highs and staying above all key levels, the chart suggests its long-term pattern remains intact as the next phase of the advance takes shape.
 Artem Voloskovets