Peter Smith

⬤ Microsoft is starting to show signs of a potential reversal as the broader market tries to find its footing. Bullish RSI divergences are popping up across multiple major stocks, and Microsoft is one of the names displaying a shift in momentum. The MSFT daily chart shows the price bouncing back after sliding toward the 490 area, with a fresh "Bull" signal reflecting improved short-term sentiment.
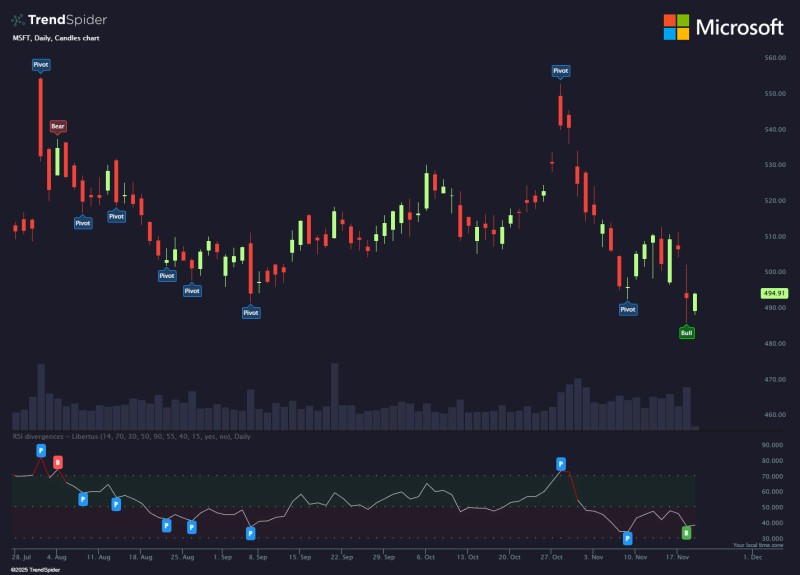
⬤ The chart shows a series of pivots forming over recent months, with the latest bullish signal coming after the stock pulled back from above 550. The RSI divergence suggests the selling pressure is weakening, even though price briefly dipped under 500. Candlestick action in the highlighted zone hints at reversal energy building, with several green candles showing up after an extended stretch of selling. Automated signals also mark previous turning points that help shape the bigger technical picture.
⬤ Similar technical patterns are showing up across other large-cap stocks, with Microsoft standing out among those displaying early reversal structure. The RSI indicator on the MSFT chart has moved away from its recent lows and is climbing back toward neutral ground, which lines up with signs of broader market stabilization. Trading volume has stayed consistent, pointing to steady participation rather than panic selling during the latest downturn.
⬤ This pattern matters because Microsoft often sets the tone for the entire technology sector, and early strength in MSFT could shape expectations for upcoming trading sessions. Bullish divergences tend to act as early warnings of short-term trend reversals, particularly when they show up as markets start to recover. Microsoft's improving setup highlights what could be a meaningful turning point for one of the market's biggest and most watched companies.
 Peter Smith