Marina Lyubimova

Meta Platforms has pulled back to price levels last seen in April 2025, landing at a technically significant spot that could define the stock's trajectory for months ahead. According to The Analyst, the current structure reflects a controlled correction within a broader bullish trend - and the $443 level is where the whole thesis gets tested.
The Correction May Have More Room to Run
After topping out near the $750-$800 range, META began printing lower highs and steadily worked its way into a retracement phase. Price is now pressing against the 0.382 Fibonacci level near $527, but the overall corrective structure suggests the move may not be fully complete.
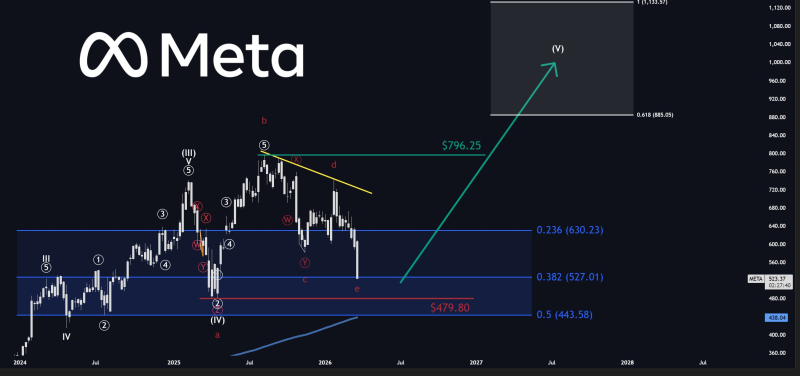
A descending trendline from the highs keeps capping any recovery attempts, reinforcing the idea that sellers are still in control of the short-term direction.
Why $443 Is the Make-or-Break Level for META Stock
The $443 zone is where the bullish case either holds or collapses. It aligns with the 0.5 Fibonacci retracement at $443.58 and marks the lower boundary of the demand zone. That makes it the structural floor for any continued upside thesis.
The framework breaks down like this:
- $527 (0.382) is currently under pressure
- $479.80 acts as a key internal pivot
- $443 defines the structural floor for the bullish scenario
Holding above $479.80 raises the odds of an early bottom forming. A slide toward $443 would extend the correction but still keep the broader bullish setup intact.
Price compressing within a horizontal support band while lower highs continue to form - a market in decision mode.
META Breaks 100-Week MA for First Time Since 2022-2023 Cycle captured an earlier stage of this same deterioration, showing the breakdown that set this correction in motion.
META Stock Compression Signals a Decision Point Is Close
The chart shows price tightening inside a horizontal support band roughly between $440 and $630, while lower highs keep forming overhead. That combination typically precedes a directional move - the question is which way.
What the chart confirms right now:
- Price remains below descending resistance
- No higher highs have formed yet
- The corrective wave structure is still active
But support has not given way either, which keeps the bullish projections alive as long as $443 holds.
Support has not been broken, which keeps bullish projections valid as long as the lower boundary holds.
META Stock Slides to $547 as $540 Support Weakens and Legal Risk Grows and META Stock Analysis: Wave 2 Correction Risk Near $477-$576 Support Zone both tracked the progressive pressure on these same levels, pointing to a pattern of support tests deepening over time.
Two Paths, Both Pointing Higher
The chart lays out two scenarios, each leading higher but on different timelines:
- A deeper push toward $443 before a reversal targeting $885
- An early bottom above $479.80, leading to a faster impulsive move toward $1,032
The absence of structural breakdown keeps the broader trend intact, while current compression suggests the next move is likely to be decisive.
Both paths depend on support holding. The structure is not broken - it is just being tested. What happens at these levels in the coming sessions will likely determine whether META accelerates toward four figures or needs one more leg down first.
 Marina Lyubimova