 Usman Salis

⬤ Meta Platforms (META) is still grinding along the bottom of its price channel, trading around $610 after weeks of sustained selling pressure. The stock has been stuck in oversold territory, struggling to find footing after a steep decline from earlier highs.
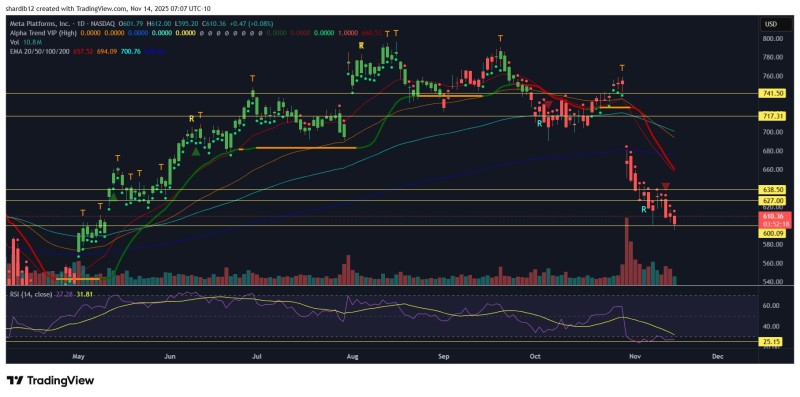
⬤ The chart shows a sharp drop from the $740–$760 zone in early autumn, with META breaking through key support levels at $717, $660, and $638. Now it's hovering just above the next major support near $600. The RSI sits around 25—firmly in oversold territory—while short-term moving averages all point downward, confirming weak momentum.
⬤ Volume data shows heavier selling during the decline, and each bounce attempt has stalled near $627, where the price keeps reversing. META is trading below its 20-day, 50-day, and 100-day moving averages, all of which are trending lower and reinforcing the downtrend as the stock clings to the channel's lower boundary.
⬤ META's position at the channel bottom with deeply oversold readings reflects the broader pressure on large-cap tech stocks. The key question now is whether the stock stabilizes here or continues sliding along the downtrend visible on the chart.
 Usman Salis


