Saad Ullah

Meta's stock has been a tech darling for months, but the chart is now flashing warning signs. With Meta closing below its 200-day moving average for two straight sessions, traders are starting to wonder if the rally has run its course.
The Technical Picture
Technical analyst kpak recently spotted a classic bearish head and shoulders pattern taking shape—a signal that often precedes trend reversals.
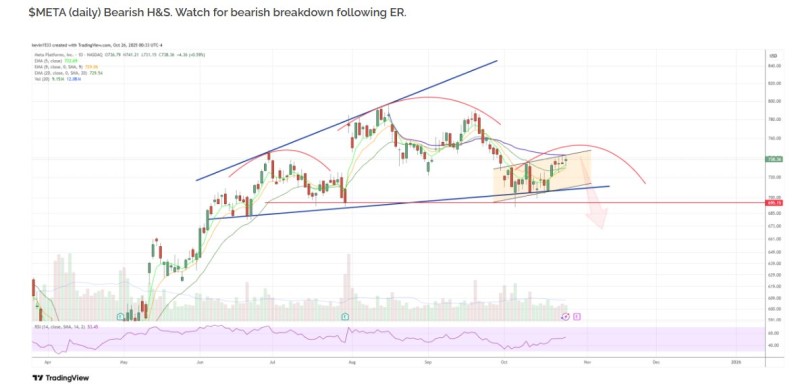
The head and shoulders pattern is playing out in textbook fashion:
- Left shoulder formed during the summer rally
- Head peaked near $820 in August—Meta's recent high
- Right shoulder came through a weaker October rebound
The key level to watch now is the neckline around $715–$725. If Meta breaks convincingly below that, the measured downside target sits near $690–$700. Adding to the concern, the stock broke down from a rising wedge pattern, and the RSI continues trending lower—showing fading momentum even during small bounces.
What's Driving the Weakness?
Meta's recent earnings weren't bad—revenue growth was solid—but Wall Street didn't love the rising AI infrastructure costs and ongoing Reality Labs losses. After a strong multi-quarter run, traders seem to be taking profits. Throw in some broader tech weakness and higher Treasury yields, and you've got a recipe for caution.
If Meta can claw back above $750 and hold it, the bearish setup might fall apart and buyers could regain control. But if it keeps closing below the 200-day moving average, expect more downside pressure toward $680–$700. For now, the momentum has clearly shifted—and unless buyers show up fast, Meta could be in for a rougher stretch ahead.
 Saad Ullah