Artem Voloskovets

After a stunning rally since early 2023, Meta's stock is showing real signs of fatigue. The company just broke below a key two-year trendline with the highest weekly trading volume seen since July 2023—suggesting this isn't just a minor pullback. The stock has also slipped below its 200-day moving average for two sessions in a row, something we haven't seen since 2022.
What the Chart Is Telling Us
As trader Heisenberg put it, "Bulls gotta look from the bear's perspective." Right now, the chart is flashing warning signs, and unless buyers step in soon to reclaim lost ground, further downside could be on the horizon.
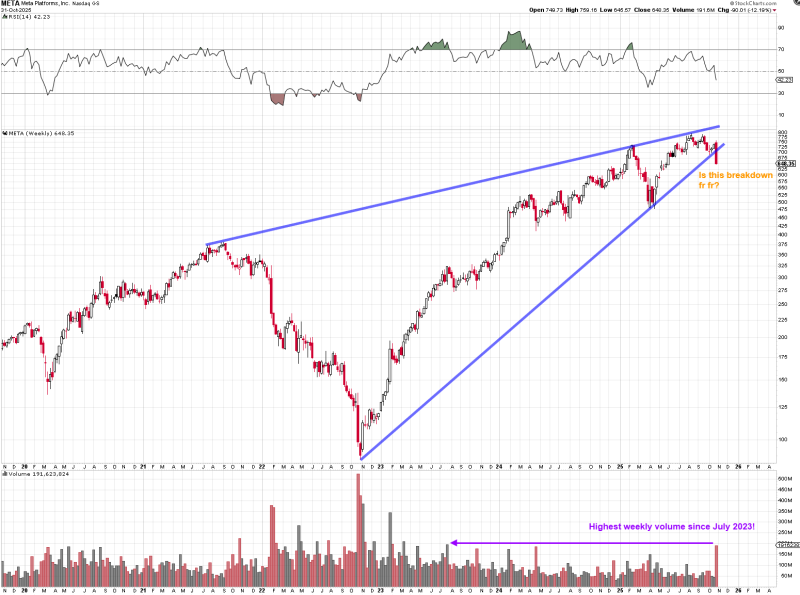
Meta's weekly chart shows a textbook rising wedge pattern—a bearish setup that often leads to reversals once the bottom line breaks. And that's exactly what just happened. The stock dropped convincingly below the wedge's support on massive volume, confirming strong selling pressure. The RSI sits around 42, which means momentum is weakening but there's still room to fall before things get oversold. Meta closed near $648, extending a multi-week slide and staying under that important 200-day average. When you combine technical weakness with this kind of volume spike, it's hard to ignore—this breakdown looks real.
Beyond the technicals, there are some bigger picture headwinds at play. Meta's growth has cooled compared to last year, Reality Labs keeps bleeding money, and the company's AI spending spree is squeezing margins. On top of that, investors are rotating out of expensive megacap tech stocks and into cyclicals and defensive plays. That's why we're seeing persistent selling instead of the usual "buy the dip" crowd jumping in.
Here's what traders are watching:
- Resistance: $700–$725 (where support used to be)
- Support: $620–$600 (a major historical demand zone)
- RSI: ~42 (neutral-to-bearish, with room to drop)
- Volume: Highest weekly turnover since July 2023—likely institutional players repositioning
Bottom Line
Meta is at a crossroads. If it can't reclaim that broken trendline soon, we could see a slide toward $580–$600, which is a critical long-term support area. On the flip side, a strong bounce back above $700 would flip the script and get the bulls excited again. For now though, the chart is leaning bearish—and Meta needs a convincing November to prove otherwise.
 Artem Voloskovets