Peter Smith

⬤ Questions are popping up about whether the recent drop in Meta Platforms creates a buying opportunity, but there's clear hesitation to jump in at these levels. The chart shows META falling to around $594 after breaking through major horizontal support near $700. This sustained decline follows several weeks of lower highs and reflects serious deterioration across the stock's short-term trend structure.
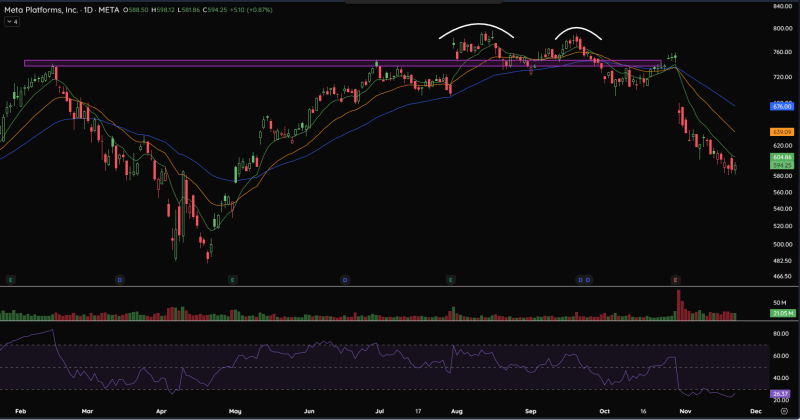
⬤ The chart highlights a rounded double-top pattern near the late-summer peak close to $800, followed by a steady rejection that accelerated the downturn. META then dropped below the purple support band (now turned resistance) and slipped under short-term moving averages, which have started pointing downward. Volume has stayed relatively stable, but price action keeps showing persistent selling interest as bounce attempts fizzle out. The reversal really stands out after such a strong multi-month rally earlier in the year.
⬤ Technical signals confirm the downside momentum. RSI has tumbled into the mid-20s, putting META in deeply oversold territory. Previous dips to similar levels on the chart led to heightened volatility rather than quick recoveries. The series of lower lows and lower highs since late September shows an unbroken bearish pattern, while the stock sits well below its cluster of moving averages.
⬤ This matters because Meta Platforms is a heavyweight in major tech indices, and extended weakness here can drag down sentiment across the broader high-growth tech sector. The breakdown from key support combined with momentum indicators in the gutter represents a crucial turning point for the mega-cap technology landscape.
 Peter Smith