Peter Smith

Crypto mining stocks have had a rough few months, and IREN Limited is no exception. After posting an aggressive rally, the stock has pulled back into a corrective phase that has traders watching a handful of key price levels very closely. The monthly chart now tells a clear story — IREN is in a holding pattern, and the next directional move will likely be decided in the $40 to $47 range. Whether that resolves to the upside or downside depends on how price behaves around resistance.
$47 Is the Line in the Sand on the Monthly Chart
IREN is currently trading around $40.95, consolidating near the 0.5 Fibonacci retracement at $40.85 and holding above the 0.618 level at $32.44. The monthly chart confirms a corrective structure following a prior impulsive move — a normal sequence, but one that still carries downside risk if key levels fail to hold.
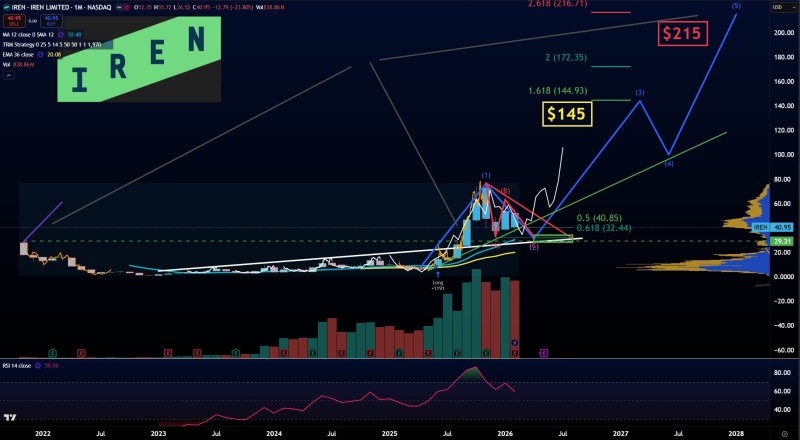
Market commentary has pointed out that the broader structure remains constructive when viewed from a higher timeframe, suggesting the long-term uptrend is not broken. Near term, though, $47 is the ceiling that matters. Without a clean break above it, price may continue working lower before stabilizing. Traders have flagged similar dynamics before, noting wedge pattern compression beneath resistance zones where tight consolidation tends to precede a sharp directional expansion.
Fibonacci Extensions Show Targets at $144 and $215 if Buyers Step In
If IREN clears $47 with conviction, the Fibonacci extension levels on the monthly chart open up meaningful upside. The 1.618 target sits near $144.93, followed by a projection around $172.35, and a 2.618 extension reaching roughly $215 if a new impulse wave develops from current levels. Those are ambitious long-range targets, but they reflect the scale of the prior move and the potential for a similar run if accumulation in this zone holds. Volume data supports the thesis — notable participation has been clustered between the low $30s and low $40s, reinforcing this range as an active area of interest for buyers.
The downside scenario is equally well-defined. Previous analysis highlighted loss of key support near $43 and risk toward $36, reflecting how quickly sentiment can shift when price loses footing below resistance. Earlier commentary also noted that IREN experienced a rally stalling below critical resistance after outsized gains — a dynamic that closely mirrors what is playing out on the chart today. The setup is clean. A sustained move above $47 flips the narrative bullish and brings extension targets into view. Continued rejection keeps the corrective pressure alive, with $36 as the next meaningful level to watch on the downside.
 Peter Smith