 Usman Salis

⬤Iris Energy is trading around $42 inside a corrective structure that followed a prior rally. The TD indicator remains bearish, pointing to the absence of meaningful accumulation. The chart shows a series of lower highs forming under a descending resistance trendline, confirming that sellers are still in control of the current phase.
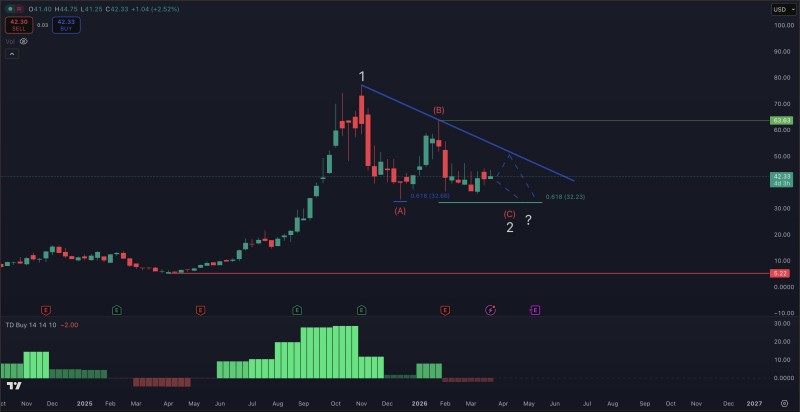
⬤Price has traced a classic ABC corrective pattern since peaking near $70. IREN is now consolidating below resistance, with a support zone holding in the low-$40 area. As covered in IREN Stock Falls Toward $33 Support After Bear Flag Breakdown, technical patterns previously suggested the stock could push into the low-$30s, and the current setup echoes that setup.
⬤The 0.618 Fibonacci retracement near $32 stands out as the key downside target. Consolidation at current levels reflects indecision rather than strength. This dynamic mirrors what was observed in IREN Limited Eyes $145 and $215 Price Targets in a Multi-Year Breakout Setup, where momentum stalled sharply after a strong advance as buyers failed to push through overhead supply.
⬤IREN sits at a technically critical juncture. Holding current levels could delay further selling, but without a buildup in accumulation, the path toward deeper support remains open. This compression mirrors the pattern noted in IREN Stock Rises 1% as MSCI Index Inclusion Drives Buying, where price squeeze preceded a larger directional move.
 Usman Salis


