 Peter Smith
Intel's recovery story just hit another snag. The chip giant closed down 2.15% at $24.08 on September 12th, showing that even with promising developments in its desktop lineup, the market isn't buying the turnaround story just yet.
Key Technical Levels to Watch:
According to Stock Ticker ZONE, the technical picture tells a story of hesitation and consolidation rather than the breakout investors have been hoping for.
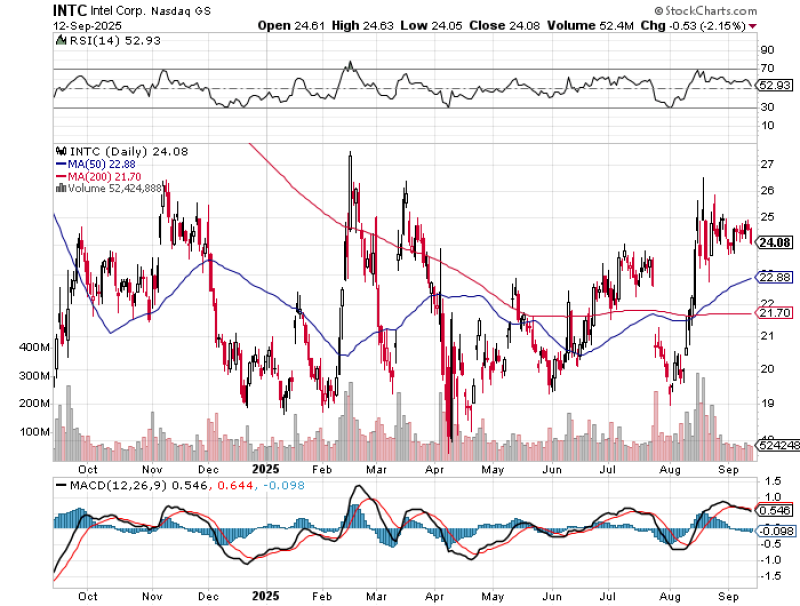
- Resistance: $26-$28 zone proving difficult to crack
- Support: 50-day MA at $22.88 and 200-day MA at $21.70 holding firm
- RSI: Neutral at 52.93 - no clear momentum either way
- Volume: Average 52.4M shares - lacking conviction from either side
The daily chart shows Intel stuck in no-man's land. While it's managed to stay above both key moving averages, suggesting the medium-term trend isn't completely broken, the stock can't seem to punch through that stubborn $26 resistance level. The MACD turning slightly negative doesn't help either, hinting that whatever momentum Intel had might be fading.
What's really weighing on the stock is the broader competitive landscape. AMD and NVIDIA continue to dominate the high-performance chip space, and Intel's playing catch-up in a game where second place often means irrelevance. Sure, there are signs of improvement in Intel's desktop offerings, but investors remain skeptical about whether these gains can translate into meaningful market share recovery.
The macro environment isn't helping either. Global chip demand has cooled, and geopolitical tensions around semiconductor supply chains keep adding uncertainty to the mix. For Intel to break out of this sideways trading pattern between $22 and $26, it needs either major product wins or some serious policy support for domestic chipmakers.
 Peter Smith


