 Eseandre Mordi
⬤ Hims & Hers Health Inc. (HIMS) keeps trending downward on the daily chart, with price action showing persistent weakness after its sharp drop from last year's highs. The stock's hovering near $30, staying well below the key mid-range levels it hit during its previous run-up. What's telling? Price keeps hugging the lower edge of its volatility bands—that's not a temporary dip, it's sustained selling pressure.
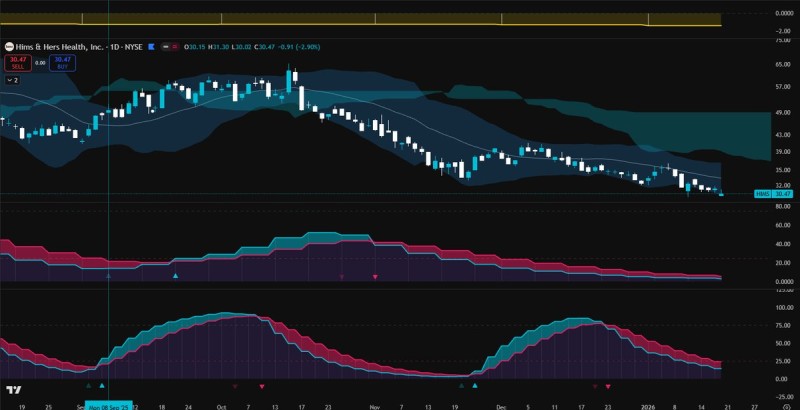
⬤ Here's where momentum tells the real story. During the last period when both stochastic indicators turned upward together, HIMS exploded from around $50 to $65 in a compressed timeframe. But right now? Both stochastic measures are still pointing down, meaning momentum conditions haven't flipped to favor any sustained recovery. The energy just isn't there yet.
⬤ The broader price structure backs up this cautious read. HIMS has been printing lower highs and lower lows for months now—that's textbook correction territory, not consolidation near peaks. Sure, there've been brief pauses and minor bounces, but none came with improving momentum signals. The indicators continue reflecting subdued strength, suggesting downside pressure hasn't fully run its course.
⬤ Why does this technical phase matter? Because HIMS has a track record of explosive directional moves once momentum conditions line up. Until those signals start stabilizing and turning higher, the stock looks to be in watch-and-wait mode rather than gearing up for renewed strength. How momentum develops from here will likely decide whether HIMS keeps consolidating at these lower levels or finally starts building the foundation for a broader trend reversal.
 Eseandre Mordi


