 Marina Lyubimova
⬤ Hims & Hers Health Inc. (HIMS) is sitting at a make-or-break technical spot on the weekly chart as the price compresses around the $30–$31 area. The stock has pulled back into a well-defined horizontal support zone that's acted as a key pivot during the broader uptrend. This week could be the deciding factor in whether this level holds or breaks.
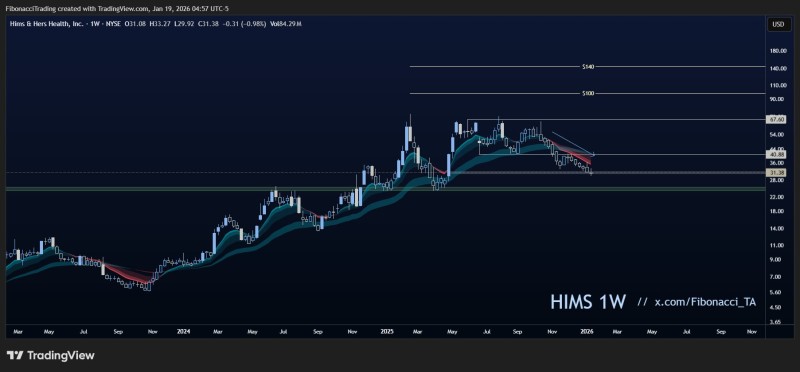
⬤ The chart shows a solid rally through 2024 into early 2025, backed by rising trend structure and moving averages. After topping out above $50, HIMS shifted into correction mode with lower highs and a steady pullback. That move has brought the price right back to the green support band near $30—an area that used to be resistance before flipping to support.
⬤ Recent weekly candles show the selling pressure is easing as price approaches this zone. The decline has become more controlled, with tighter ranges and less aggressive follow-through. There's a visible descending channel during the correction, and price is now trading near its lower edge. If the current level gives way, the next support zone on the chart sits around $25.
⬤ This setup matters because reactions at long-term support levels often shape sentiment around whether a trend can hold. When a stock revisits widely watched levels after a big run, traders and investors reassess their positioning. For HIMS, holding above $30–$31 would signal the structure is still intact. A deeper drop toward $25 would likely extend the consolidation before any clear direction emerges.
 Marina Lyubimova


