 Marina Lyubimova

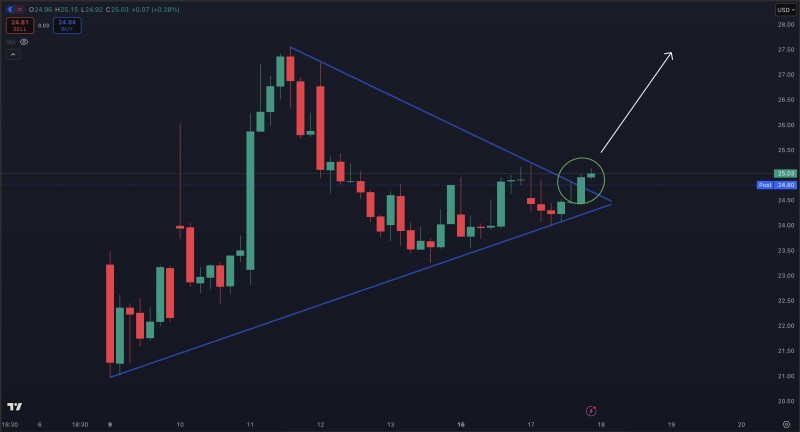
HIMS stock is sitting at a technical crossroads. After a volatile stretch that included a 40% spike and a prolonged consolidation phase, the chart is now coiling near a key resistance zone around $25. The pattern is tightening, the higher lows are stacking up, and a directional move looks increasingly close. Bulls appear to be in control for now, but the next session could decide whether this momentum holds or stalls.
Ascending Triangle Near $25 Points to Potential Breakout
The price action in HIMS has taken the shape of an ascending triangle, a structure defined by rising lows pressing into a flat or declining resistance ceiling. The stock has repeatedly tested the upper boundary near $25, failing to break through but also refusing to pull back meaningfully. That kind of sustained pressure typically signals accumulation, not distribution. As HIMS stock jumped 40% as Hims and Hers tested its breakout level, rapid sentiment shifts already showed just how explosive moves can get when conditions align.
Gamma Wall at $26 and Low Overhead Resistance Could Accelerate the Move
The $26 level matters for more than just chart reasons. Analysis covering how HIMS stock broke the $26 gamma wall as dealer hedging drove the move showed that technical thresholds can trigger self-reinforcing buying once cleared. Dealer positioning at key strikes tends to amplify moves in either direction, especially in a stock with HIMS's retail following and options activity. Beyond $26, the picture becomes clearer: reporting on how HIMS stock faces little resistance until $30 as price stabilizes suggests minimal overhead supply once the current zone gives way. That kind of open road is what makes the setup worth watching. Rejection from here, on the other hand, would likely extend the range and push resolution further out.
 Marina Lyubimova


