 Alex Dudov
⬤ Hims & Hers Health Inc. caught traders' attention after a steep selloff drove shares down to around $27. The drop came close to the $25 downside target that analysts had been watching, but the stock found support and began stabilizing in the high twenties.
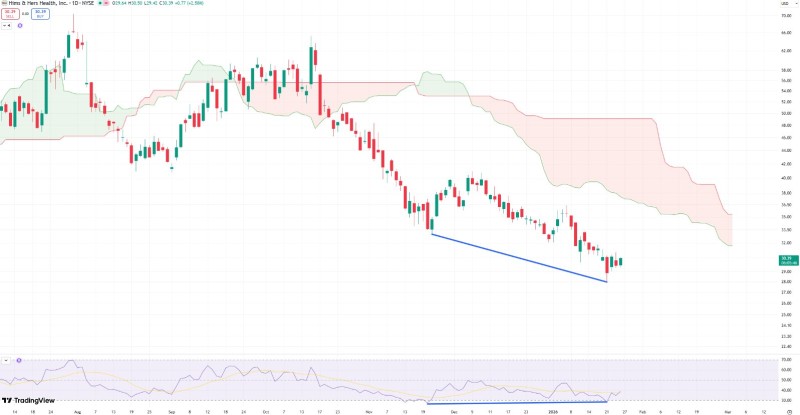
⬤ Looking at the daily chart, HIMS has been in a rough patch lately. After trading above $50 not too long ago, shares have been sliding lower and sitting below key cloud indicators. The overall trend still looks weak, but here's the interesting part: the selling seems to be losing steam. Price has been bouncing between $27 and $30, which suggests buyers might be starting to step in.
⬤ The most notable technical signal right now is a bullish divergence showing up on the daily timeframe. While the stock made a new low during the recent drop, momentum indicators didn't follow suit—they actually formed higher lows. This disconnect often means the downward pressure is running out of gas. That long wick down to $27 shows sellers tried pushing lower but couldn't hold those levels.
⬤ Why does this matter? Bullish divergences like this tend to pop up when a stock is done falling, at least temporarily. HIMS is sitting at price levels where it previously found support, and with momentum starting to stabilize, there's a real chance we could see a bounce back toward the mean. The bigger trend still looks shaky, but this short-term setup is worth watching if you're trading the stock.
 Alex Dudov


