 Artem Voloskovets
⬤ HIMS stock has been trending downward after hitting strong resistance between $55 and $70. The selloff started when price failed to push through key Fibonacci levels around the 0.786 and 1.0 retracement zones, triggering a reversal that's been playing out over the past several weeks.
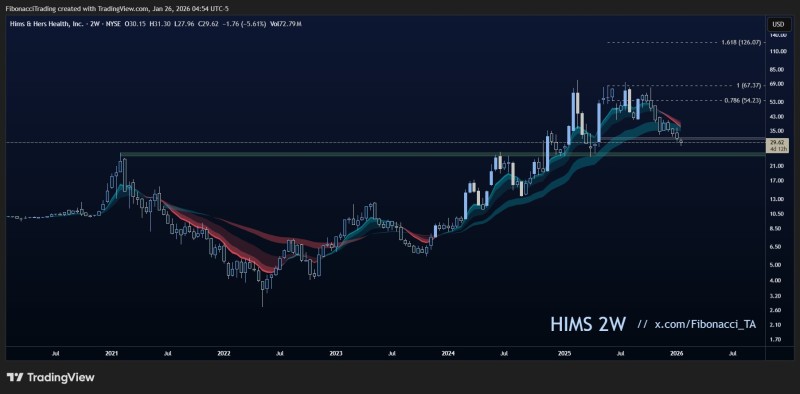
⬤ The decline has brought shares down toward a historically important support area between $28 and $25—a region that previously served as a consolidation zone during earlier rallies. This zone is drawing attention from traders as it lines up with former resistance levels that could now act as support.
⬤ What's interesting here is that the pullback has been relatively orderly without panic selling or extreme volatility. The two-week chart shows a controlled descent rather than a chaotic drop, which often happens when markets are resetting after extended rallies through deeper retracements.
⬤ How HIMS behaves around this $25-$28 support zone will likely shape its next phase. If it finds buying interest here, we could see stabilization. If it breaks through, the next leg down becomes more probable. Either way, this level is worth watching as the stock approaches a make-or-break technical zone.
 Artem Voloskovets


