 Usman Salis

⬤ Hims & Hers Health has arrived at a defining technical moment on the weekly chart. The latest weekly open places the stock right at the EMA cloud, a zone where the battle between trend continuation and stabilization tends to play out. Price is currently hovering near $15.7, which also lines up with the 0.786 Fibonacci retracement level. That combination of confluent support often acts as a strong floor during prolonged corrections, making this area one to watch closely over the coming weeks.
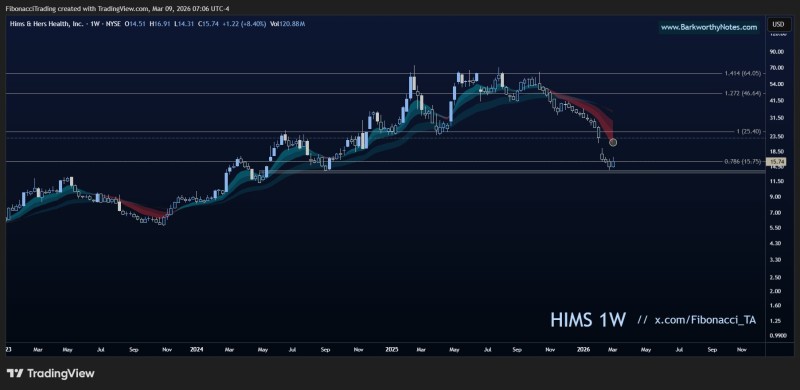
⬤The stock had previously staged a powerful multi-month rally that carried it all the way toward the $60 to $64 range before momentum reversed. Since that peak, price action has trended steadily lower, carving out a clean corrective structure on the weekly timeframe. The current decline has pulled HIMS back into the EMA cloud, which now functions as a major technical battleground. As covered in Hims & Hers Health Tests $15.75 Support After 5-Month Decline, analysts noted the stock had entered a critical support zone following months of distribution from higher levels.
⬤A clean break through the EMA cloud to the upside would likely ignite stronger buying momentum, potentially driven by short covering as bearish positions unwind after the extended decline. The flip side is a rejection at the cloud, which would keep the broader correction intact and pressure bulls to defend a higher low to maintain any constructive structure. As analyzed in HIMS Stock Slides Toward $13.5 Support as Downtrend Deepens, sustained downward pressure could expose the stock to significantly deeper support levels if the current zone fails to hold.
⬤The confluence of the weekly EMA cloud and key Fibonacci levels makes this a pivotal decision zone for HIMS. If buyers step in here, it could form the base for a genuine stabilization after the steep slide from $60. If sellers maintain control, bearish momentum that has been compounding for months is likely to continue. This scenario was flagged earlier in HIMS Stock Nears $25 Support as Shares Drop From $60 Peak, where analysts highlighted the scale and persistence of the correction following the prior rally.
 Usman Salis


