 Artem Voloskovets
After a sluggish start to 2025, Google's stock has roared back to life. Shares have climbed from $139.78 in April to nearly $300 by late October—a jaw-dropping 107% gain in just six months. The rally's been fueled by heavy institutional buying and rock-solid technical strength, with the stock now sitting comfortably above all its major moving averages.
What the Chart Shows
According to a chart shared by TrendSpider, GOOG is checking every box on the Minervini Trend Template, a framework pro traders use to identify leading stocks.
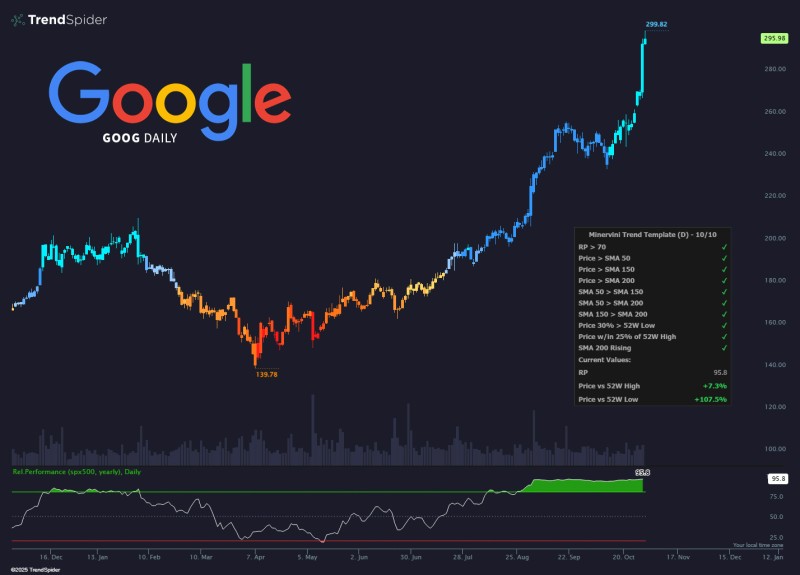
Google's technical setup is textbook bullish. Every indicator is firing on all cylinders:
- Price gains: Up 107.5% from its 52-week low, and just 7.3% below its all-time high
- Moving average alignment: The 50-day sits above the 150-day, which sits above the 200-day—all trending upward
- Relative Strength: 95.8, meaning Google is crushing the broader S&P 500
- RSI: Around 95, technically overbought but often a sign of acceleration in strong trends
- Volume trends: Steady accumulation signals ongoing institutional demand
Why Google's Rallying
This isn't just a technical bounce—there are real reasons behind the move. Optimism around Google's Gemini AI model has eased concerns about competition from OpenAI and Microsoft. Google Cloud just posted record margins, showing the business is getting more efficient. Add in aggressive share buybacks and a rotation back into high-quality growth stocks as rates stabilize, and you've got a perfect storm for upside.
The momentum looks strong, but traders are eyeing the $300 mark as a potential speed bump. If Google can consolidate around $285–$290, it could set up for another leg higher—possibly toward $320–$350 if AI revenue keeps surprising. On the flip side, a drop below the 50-day moving average would be the first real warning that the rally's running out of gas.
 Artem Voloskovets


