 Saad Ullah

⬤ Avalanche (AVAX) is trading within a high-timeframe accumulation zone on the weekly chart following a multi-year pullback from its 2021 all-time high. The chart shows a well-defined demand area between $9 and $12 that's repeatedly held as support since 2021. This price behavior suggests ongoing accumulation at long-term support rather than a breakdown in the structure.
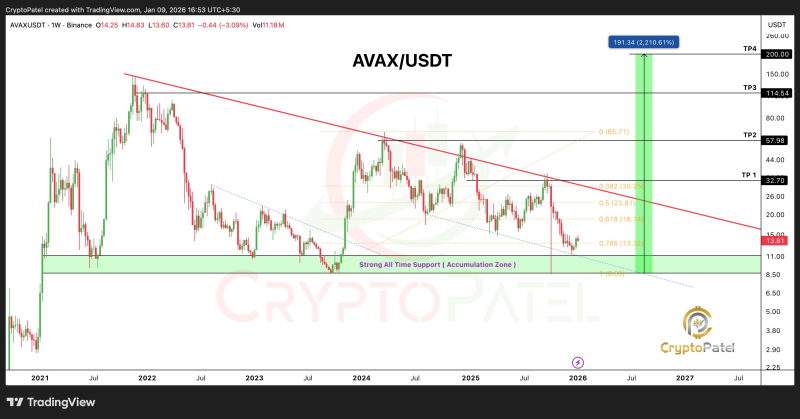
⬤ The technical setup reveals several key factors shaping the current outlook. AVAX remains constrained by a macro descending trendline from the 2021 peak, which continues acting as resistance during rallies. Recent price action shows a liquidity sweep into the demand zone followed by stabilization—a pattern commonly seen during accumulation phases. The chart identifies a weekly close above $20 as a crucial strength signal that would indicate improving momentum within the broader structure.
⬤ Multiple upside targets are outlined if the structure continues developing positively: $32, $58, $115, and ultimately above $200. These represent longer-term objectives rather than near-term price expectations. The bullish outlook stays valid as long as AVAX holds above roughly $8.50 on a weekly basis, with a weekly close below $8 marking the invalidation point that would signal loss of long-term support.
⬤ This matters because Avalanche is a major layer-one network closely watched for signs of sustained recovery after prolonged drawdowns. AVAX holding long-term support demonstrates how accumulation zones form during extended corrections and shape future trend potential. With clearly defined support, resistance, and invalidation levels, this setup shows how high-timeframe technical structures continue influencing sentiment across large-cap altcoins as the market evaluates the next cycle phase.
 Saad Ullah


