 Saad Ullah
⬤ Avalanche has found its footing at a long-term support zone following a brutal correction from its 2021 all-time high. The weekly AVAX chart shows price holding steady in a high-timeframe accumulation area, suggesting serious re-accumulation activity around historically important demand levels after years of downside pressure.
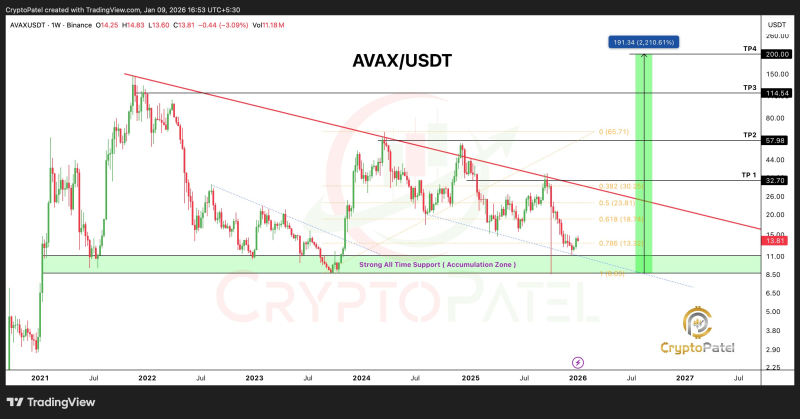
⬤ The chart identifies a strong all-time support and accumulation zone between roughly $12 and $9—an area that's sparked price reactions repeatedly since 2021. Recent action shows a liquidity sweep into this demand zone before bouncing back, typically a sign that selling pressure is getting absorbed at long-term support. However, AVAX still sits below a macro descending trendline traced from the 2021 peak, which continues acting as overhead resistance on the weekly timeframe.
⬤ From a structural standpoint, the path forward is clear. A weekly close above $20 would signal real strength and confirm AVAX is breaking away from the accumulation zone. The projected upside targets align with historical reaction points and Fibonacci extensions: $32, $58, $115, and a longer-term target approaching $200. The bullish setup stays intact as long as AVAX holds above roughly $8.50, while a weekly close below $8 would kill the structure entirely.
⬤ This technical picture carries weight beyond AVAX itself. As a major Layer 1 asset, Avalanche tends to influence sentiment across the altcoin market, especially when multi-year demand zones hold strong. The current setup underscores the importance of confirmation at higher timeframes—how price interacts with long-term support and macro resistance will determine whether Avalanche enters a new expansion phase or keeps grinding through its corrective cycle.
 Saad Ullah


