Usman Salis

⬤ Apple stock (AAPL) is exhibiting early warning signs of repeating a familiar seasonal pattern, with recent price action suggesting another potential multi-month top near December levels around $250. Similar technical setups materialized in both 2023 and 2024, when Apple peaked in late December before entering corrective phases that extended through April. The latest analysis indicates a possible topping structure may have formed approximately two weeks ago, directing focus toward longer-term trend indicators that have proven reliable in previous cycles.
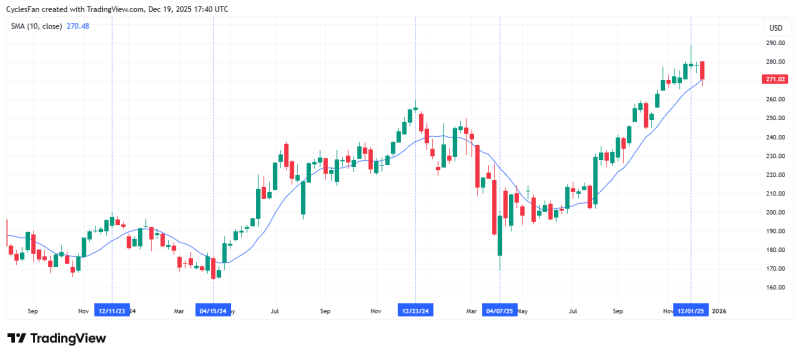
⬤ The weekly chart reveals Apple shares trading near the 10-week simple moving average, a technical level that has consistently served as a critical trend filter during past market cycles. When price confirmed weekly closes below this moving average in previous years, it marked the beginning of broader declines lasting several months. Both historical instances show that once support at this level broke, downside momentum accelerated and persisted until April, making the current technical zone particularly significant as year-end trading approaches.
⬤ Recent price action reflects diminishing upside momentum following the stock's strong advance through most of 2024. While Apple maintains position well above major long-term support levels, December rallies have historically struggled to push higher before reversing course. The moving average structure indicates weakening trend strength, and a confirmed breakdown would closely align with the seasonal pattern observed in recent years. Though no breakdown has been confirmed yet, the current setup bears striking resemblance to prior topping phases that preceded multi-month corrections.
⬤ This technical development carries broader market implications given Apple's substantial weighting in major equity indexes and its influence on overall market sentiment. A sustained pullback in AAPL could significantly impact index-level performance and amplify seasonal volatility patterns typically observed during the first quarter. Should a weekly close below the 10-week moving average materialize, it would signal the recent advance has likely transitioned into a corrective phase expected to last into mid-March or April, consistent with the historical cycles documented in the analysis.
 Usman Salis