 Marina Lyubimova

⬤ Advanced Micro Devices is back in focus after its stock fell roughly 28% from peak levels and approached a key technical threshold. AMD is now trading near $191.53, approximately 10% lower year to date, placing it right at the 200-day moving average — a widely followed long-term support indicator. The move comes amid broader turbulence across AMD Stock Eyes Critical $190 Support With Monthly BX Still Green, which flags this price region as a potential inflection point for the stock.
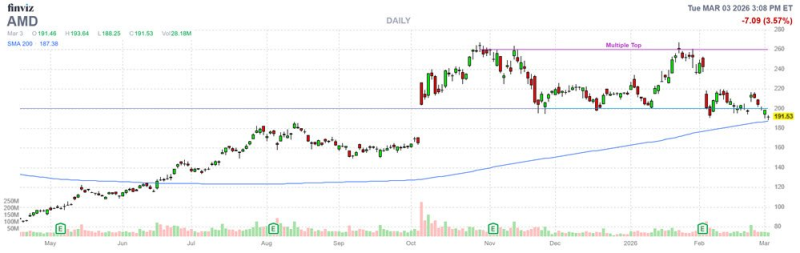
⬤ Historical data points to a notably bullish pattern around this setup. Over the past ten comparable signals, AMD traded higher one month later about 80% of the time, posting an average gain of 11.2%. Technical analysts widely treat the 200-day moving average as a dividing line between long-term bullish and bearish trends, and repeated tests of this level after an extended decline tend to attract renewed buying interest.
Options traders have turned extremely bearish, with the put-to-call ratio reaching the 98th percentile — a level that has historically coincided with short-term turning points.
⬤ Sentiment data deepens the contrarian case. The put-to-call ratio for AMD options has climbed to the 98th percentile versus historical readings — extreme bearish positioning that occasionally marks a floor when pessimism peaks. Analysis in AMD Stock Risks Drop Below $200 as Double Top Signals Weakening Momentum also underscores how the $200 area has become a critical pivot shaping near-term price direction.
⬤ The wider backdrop reflects ongoing volatility across the semiconductor sector, still closely tied to artificial intelligence demand and data center buildout. As covered in AMD Stock Jumps 30% After Breakout as Price Tests Key Resistance, AI-driven momentum has historically produced outsized moves in chip stocks once key levels are reclaimed. How AMD behaves around the 200-day moving average now may define the next directional phase for semiconductor equities broadly.
 Marina Lyubimova


