Usman Salis

Advanced Micro Devices is trading near a critical support zone, with price action aligning with a potential wave 2 accumulation phase. AMD is holding just above its 200-day moving average while appearing to complete a falling wedge pattern, with price consolidating in the $190-$195 range closely aligned with the 0.618 Fibonacci level near $194.
$194 Fibonacci Level Anchors the Corrective Structure
The current structure reflects a corrective phase after a prior bullish impulse, with price retracing into key Fibonacci zones between $194 and $174. This region is typically associated with accumulation before continuation. The falling wedge formation supports this view, as such patterns tend to precede upward moves when price stabilizes near support. In AMD Stock Holds $187 Support as Advanced Micro Devices Eyes $200, holding that floor was enough to keep the broader bullish structure intact despite market-wide pressure.
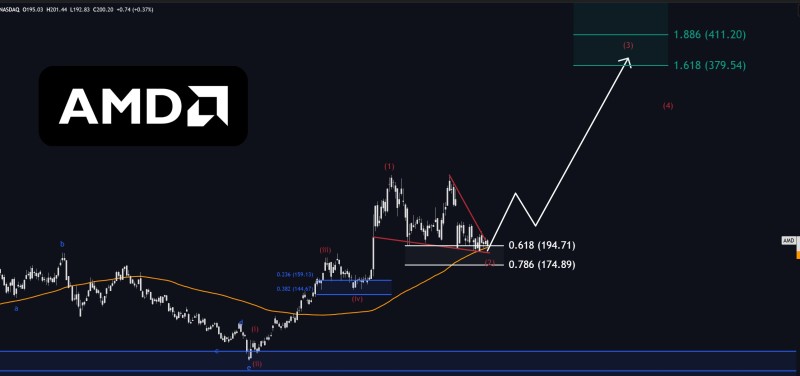
AI Capital Flows and Elliott Wave Point to $380 Target
From a broader view, AMD remains tightly linked to artificial intelligence infrastructure expansion driving long-term growth expectations. AMD Stock Analysis: AI Capital Flow Advantage describes strong investment inflows tied to AI adoption supporting the company's sector positioning. Technical projections in AMD Stock Forecast: Elliott Wave Signals Continued Upside show how similar Elliott Wave structures previously pointed to sustained bullish momentum after corrective phases - aligning with the projected $380 target for the next impulse move.
This setup places AMD at a decisive intersection of technical structure and sector-driven momentum. Completing the corrective phase could unlock a renewed push higher if broader market conditions cooperate.
 Usman Salis