 Marina Lyubimova

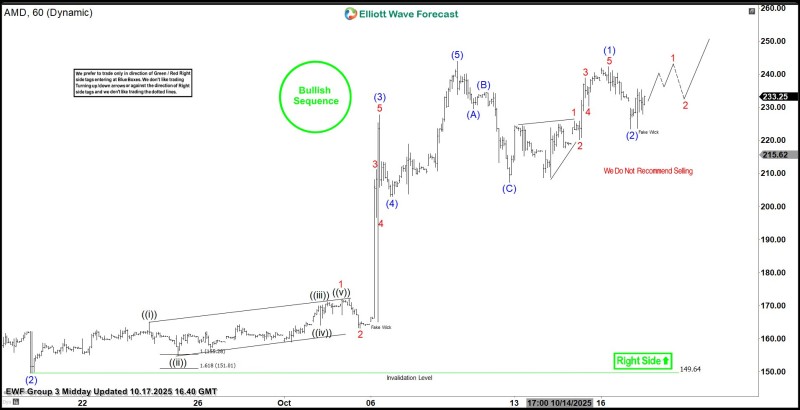
AMD's recent price action looks less like random movement and more like a structured rally. The Elliott Wave analysis points to a five-wave impulse that kicked off from $149.62—what traders call a "Right Side" setup, meaning the trend is in your favor. The folks at Elliott Wave Forecast are blunt about it: "We do not recommend selling." With AI tailwinds and solid partnerships backing the stock, the technical setup and fundamental story are lining up nicely.
The Wave Structure
Here's what the chart is telling us. AMD bottomed around $149.62 in mid-October and pushed through a clean five-wave rally, topping out above $230. After that, it pulled back in a typical three-wave correction—nothing alarming, just the market catching its breath. Now it looks like a fresh upward leg is starting, with wave 3 potentially being the strongest phase of the move.
Key technical markers:
- Launch point: $149.62 (bullish Right Side signal)
- Current range: $215–$233
- Next target: $250–$260 if wave 3 extends
- Pattern: Classic 5-3-5 impulse structure
- Analyst view: Maintain bullish bias, don't fight the trend
The beauty of Elliottwave Forecast is that wave 3 tends to be where the real action happens—fast, strong, and supported by growing momentum. That's what the chart is hinting at now.
What's Driving AMD
The technical setup wouldn't mean much without the fundamentals to back it up. AMD's MI350 accelerators are gaining traction in AI and high-performance computing, a space that's exploding right now. The company's working with heavyweights like Microsoft, Meta, and Oracle, which means broader enterprise adoption. And despite tough competition, AMD's margins and data center revenue continue to hold up well. When you combine that with a green-light technical signal, it's a compelling picture.
Elliott Wave traders stick to a simple rule: trade with the trend, not against it. The chart shows a green Right Side tag, which means the bias is bullish. You enter on pullbacks (the "Blue Boxes" on the chart) and avoid shorting just because something looks overbought. The corrective phase labeled "Fake Wick" appears to be over, meaning the path of least resistance is up.
If AMD stays above $210, the bullish case stays intact. A push above $235 would confirm the next leg higher. The only real risk is a breakdown below $149.62, which would invalidate the whole structure—but that's a long way down from here. For now, the setup favors patience and staying on the right side of the trend.
 Marina Lyubimova


