 Peter Smith
⬤ Apple pushed toward its yearly R1 pivot around $286 this week, wrapping up with what looks like a toppy weekly candle. The stock's been on a tear, but it's now bumping into the R1 resistance at $285.66 while showing hints that momentum might be fading after this extended run-up.
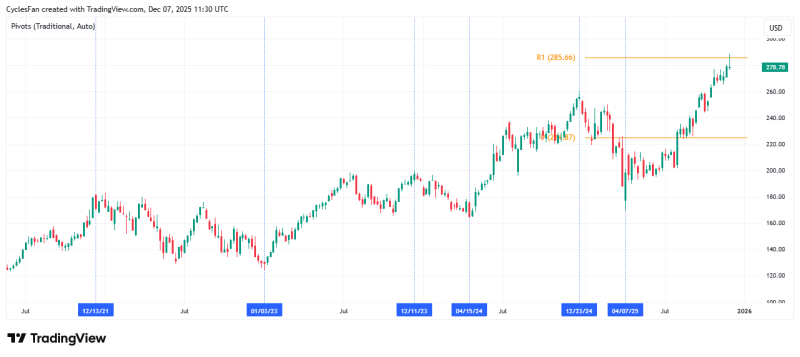
⬤ Here's the interesting part: over the last four years, Apple's formed significant multi-month tops in December—2021, 2023, and now potentially 2024. The current setup looks familiar, with the stock once again testing a major pivot zone as December rolls around. The chart shows the prior support sitting around $220, which acted as the launching pad for this latest climb toward yearly resistance.
⬤ The broader trend's still pointing up, but there's something worth watching here. Between the toppy weekly close, the proximity to R1 pivot, and Apple's track record of December peaks, we might be looking at another medium-term turning point. Based on the cycle pattern, a reversal from here could trigger a pullback lasting into March or April. Nothing's confirmed yet, but traders are definitely paying attention.
⬤ Why does this matter? Apple carries serious weight in major equity indices, so any momentum shift near this key resistance could ripple through the broader market and shake up sentiment heading into Q1. What happens around $286 will likely tell us whether this bullish trend keeps rolling or we're heading into a deeper correction.
 Peter Smith


