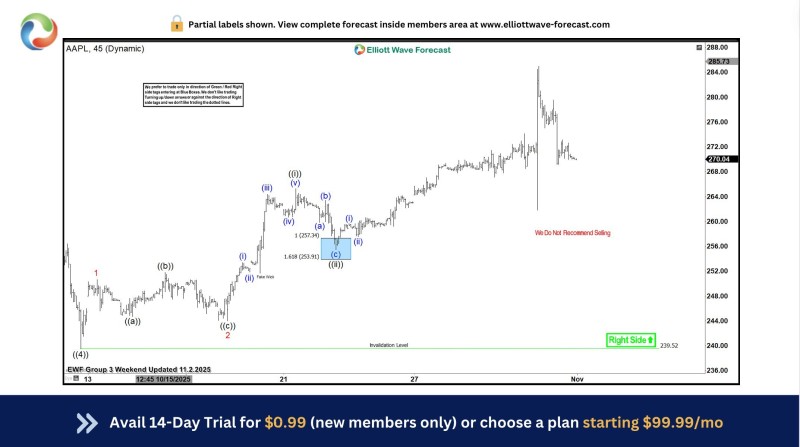
⬤ Apple delivered a solid short-term bounce after hitting the Blue Box support zone at $253-257 identified in the latest Elliott Wave update. The move let long positions shift to risk-free status based on the model's trade rules. The chart shows AAPL reversing higher right after completing its pullback and landing in the Blue Box area.

⬤ The chart reveals a finished corrective pattern marked as a ((ii)) decline, with the 1.618 extension around $253.91 forming the bottom of the support zone. From there, Apple pushed higher in clear impulsive waves that matched expectations for renewed momentum. Price ran up toward $270, spiking briefly before settling, which is typical when the right-side signal confirms a Blue Box reversal.
⬤ An invalidation level sits near $239.52, staying well below all price action during the bounce. Chart notes make it clear that selling isn't recommended while the right-side signal holds. The strong rebound confirmed the bullish setup and let traders manage longs without downside risk, following the standard approach when projected support delivers the expected reaction.
⬤ Apple's decisive rally from a clean technical zone adds fuel to the conversation about strength in big tech names. As one of the market's heaviest hitters, AAPL's upward move from a structured level can shift short-term sentiment across large-cap tech stocks. The sharp reaction from the Blue Box shows how pattern-based levels help shape expectations when traders are watching for trend continuation.
 Victoria Bazir

 Victoria Bazir


