 Eseandre Mordi

⬤ Apple stock pulled back this week, briefly touching a critical technical level before finding support. The chart shows AAPL reaching the yearly pivot around 243 at the intraweek low—a level that typically acts as an important reference point for short-term price action. This move likely marked a temporary low for the week, as selling pressure eased once the pivot was tested.
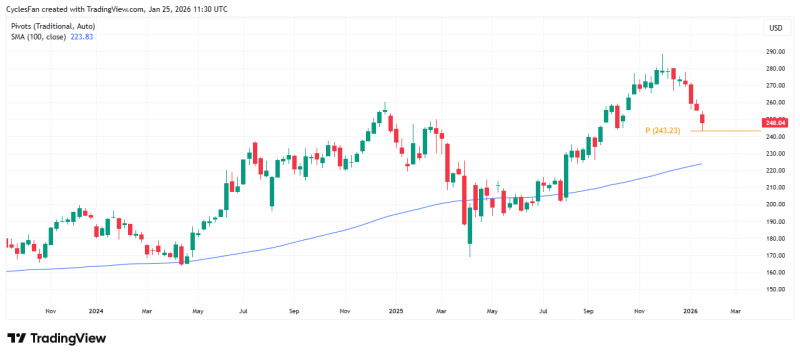
⬤ The bigger picture reveals that this pullback followed a strong run into late 2025, when Apple traded near the upper 270s to low 280s before reversing course. After peaking, the stock declined steadily until hitting the yearly pivot. The bounce from this level suggests some near-term stabilization, though it's been relatively modest so far. Price remains well below recent highs, showing that upside momentum hasn't been restored yet.
The yearly pivot around 243 served as a short-term low for the week, but the broader structure still points to further downside into March.
⬤ Looking at the trend, the chart points to ongoing downside risk. The rising 100-week moving average, sitting well below current price, stands out as the next major target on the downside. While the yearly pivot may have helped establish a short-term floor, the overall trend structure remains bearish, supporting the view that weakness could persist into March. Extended corrections often retrace toward longer-term moving averages, especially after prolonged rallies.
⬤ This matters for the broader market because Apple carries massive weight in major equity indices. Short-term stabilization might limit immediate volatility, but continued weakness toward the 100-week moving average would reinforce a cautious outlook. How AAPL handles longer-term support levels could shape market sentiment and influence expectations for the durability of recent equity strength in the weeks ahead.
 Eseandre Mordi


