 Eseandre Mordi

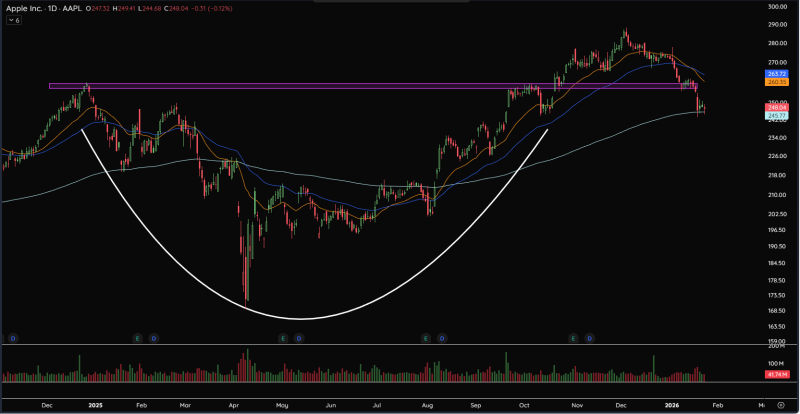
⬤ Apple shares are hovering around $248, sitting directly on the 200-day moving average as the tech giant prepares to report quarterly results. After pulling back from highs near $280 in late 2025, the stock has steadily declined and now finds itself testing this crucial long-term support level that traders watch closely during periods of uncertainty.
⬤ The daily chart reveals a concerning technical picture—shorter-term moving averages have crossed below the current price, making the 200-day line even more significant. Apple built a rounded top formation over the past year, rallying strongly from spring lows before peaking and then losing momentum. Now price action has slowed considerably as the stock reaches this make-or-break support zone.
Apple is currently sitting on its 200-day moving average with earnings scheduled this week.
⬤ A resistance zone around the mid-$260s looms overhead, while trading volume remains relatively quiet. What happens at this $248 level matters beyond just Apple shareholders—as one of the market's heavyweight stocks, Apple's technical setup heading into earnings could ripple through the broader tech sector and major indices. The next few sessions will reveal whether this long-term support holds or gives way to further selling pressure.
 Eseandre Mordi


