 Saad Ullah

Credit markets don't usually make headlines, but when technology sector spreads hit levels not seen in over two years, it's hard to look away. That's exactly what's happening right now. High-yield tech spreads have blown out to 556 basis points, investment-grade tech has crossed above the broader IG benchmark for the first time since the global financial crisis, and traders are quietly repricing what it actually costs to lend money to a tech company. Whether you're watching macro flows or just trying to understand why funding conditions feel tighter than a year ago, this is the story worth following.
HY Tech Spreads at 556bps: The Widest Gap in 29 Months
US technology credit markets are flashing a clear warning. USD HY Technology OAS hit 556.097 bps versus just 361.167 bps for USD HY All Sectors. That gap, roughly 195 extra basis points for lower-rated tech debt, hasn't been seen in 29 months. The chart is not subtle: tech spreads have accelerated sharply away from the general HY index, signaling that riskier tech debt is now treated as significantly more dangerous than most of the high-yield universe.
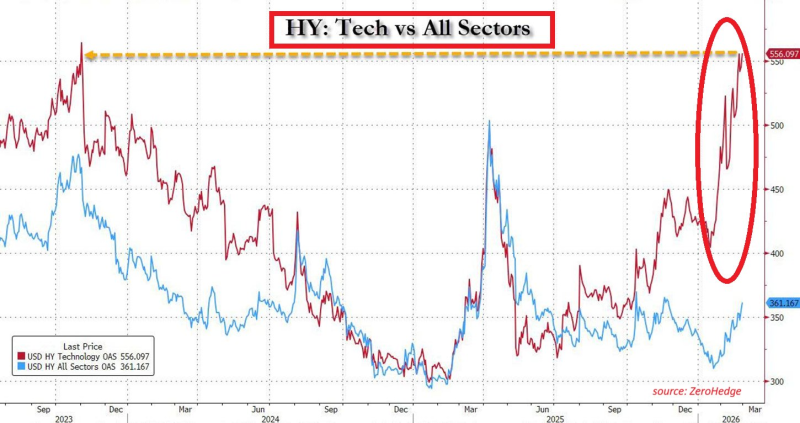
This kind of widening translates directly into higher borrowing costs. Companies that need to refinance or tap markets for new capital are now doing so at a meaningful premium. For context on how unusual spread dislocations can get, take a look at the France vs. Italy historic 10-year yield spread inversion -- anomalies like these rarely resolve quickly.
$1.2 Trillion in AI Debt: Why IG Tech Just Crossed the Broader Index
The high-yield story is striking, but what's happening in investment-grade tech may actually be more unusual. IG tech spreads have reportedly climbed above the broader IG index for the first time since the global financial crisis. When investment-grade tech, historically a safe and liquid corner of the credit market, starts trading at a premium to the overall index, it signals something beyond routine risk-off repositioning.
A major factor is the sheer scale of AI-related debt. That segment now represents roughly 14% of the IG index, totaling around $1.2 trillion and exceeding some major banking components. The rapid growth of AI-linked issuance has changed the composition of the index itself. As investors reassess growth assumptions and capital spending timelines, that concentration becomes a risk that's hard to ignore. For a single-stock example of how credit and equity markets can diverge, the ORCL stock and CDS divergence is worth reading.
Widening spreads across both HY and IG tech point to the same conclusion: rising costs of capital and a credit market that is pricing in sector risk before equity markets fully reflect it. In this environment, the old playbook of simply owning more assets may not be enough. Diversification in 2025 looks very different from a year ago, and tech credit is one of the clearest examples of why.
 Saad Ullah


