Eseandre Mordi

⬤ Solana is under sustained technical pressure, trading near $91 while the 100-day moving average looms at $109. Every push toward that level has ended in rejection, cementing it as a key resistance zone traders keep watching. Solana rebounds from $80 support, eyes $100 detailed how recovery attempts tend to stall well before reaching major moving averages.
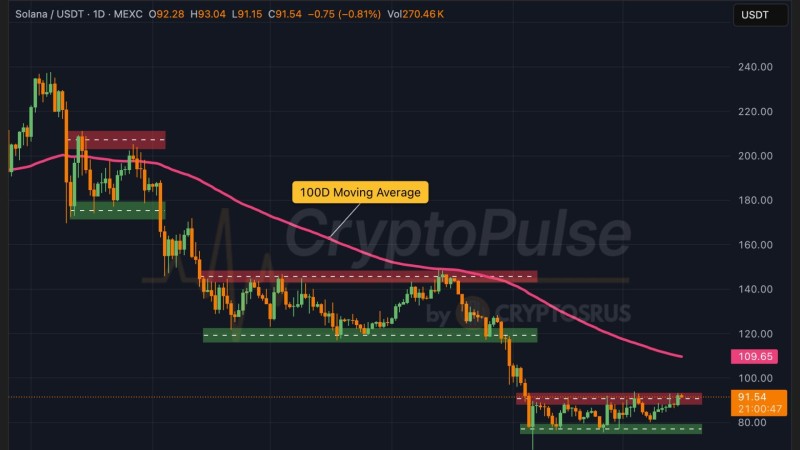
⬤ The broader chart tells a clear story: a downward structure with multiple failed rallies beneath a declining 100-day MA. When SOL trades persistently below this indicator, it reinforces a bearish setup, with upside momentum fading quickly near overhead resistance. The moving average is not just a number but a dynamic ceiling that keeps shifting momentum sellers in control.
⬤ Short-term, SOL is consolidating between roughly $80 support and a ceiling around $91-$92. SOL price analysis: $92 resistance in focus after $80 bounce highlights how this narrow band has become a battleground. A clean break above $92 could open a run toward higher levels, but continued failure there keeps the path toward $80 and below in play, as outlined in Solana faces wave 3 risk below $86.90.
⬤ Longer term, the $109 level carries weight well beyond a single trade setup. When a major asset like SOL spends extended time beneath its 100-day MA, it signals weakened momentum and cautious market sentiment. How price reacts the next time it approaches $109 will likely define whether Solana begins a genuine recovery or extends its current downtrend.
 Eseandre Mordi