 Marina Lyubimova
⬤ If you could somehow avoid the S&P 500's 10 worst trading days since 1995, your returns would look wildly different. Cutting out those nightmare sessions would've delivered a massive +6,400% return. That's more than double what actually happened in real life.
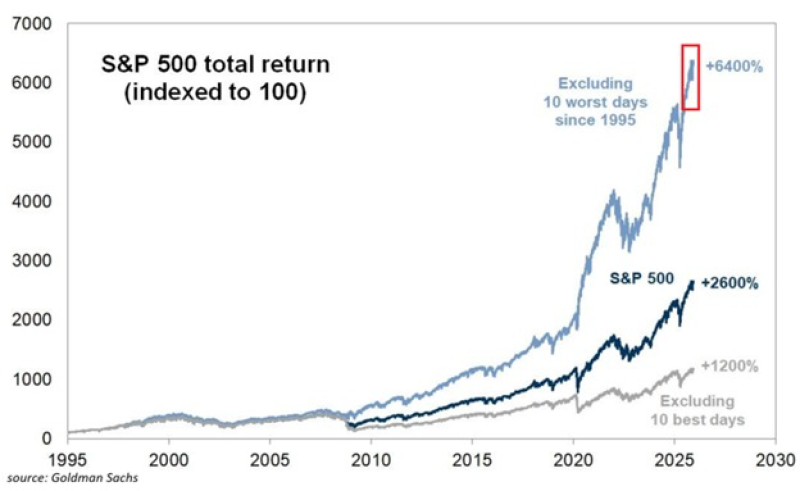
⬤ Here's the reality check: the S&P 500's actual total return since 1995 comes in around +2,600%. Remove the 10 best days instead, and you're looking at roughly +1,200%. The math tells a clear story—those brutal down days hurt way more than the best rallies helped. It's not a balanced equation.
The asymmetric impact of severe drawdowns has permanently altered long-term equity performance in ways most investors underestimate.
⬤ The real damage happened during crisis moments. Five of those 10 worst days hit during the 2008 financial meltdown, which ripped open a gap that never closed. Then 2020 added three more terrible days when COVID panic peaked. You can see these events as sharp breaks in the chart where the different scenarios suddenly pull apart and never converge again.
⬤ What this really means: a handful of catastrophic days can define decades of investing. The S&P 500's long-term story isn't written by steady growth—it's shaped by rare disasters that overpower even the strongest rallies. As volatility keeps spiking in cycles, understanding how these critical moments work matters more than tracking daily noise.
 Marina Lyubimova


