Peter Smith

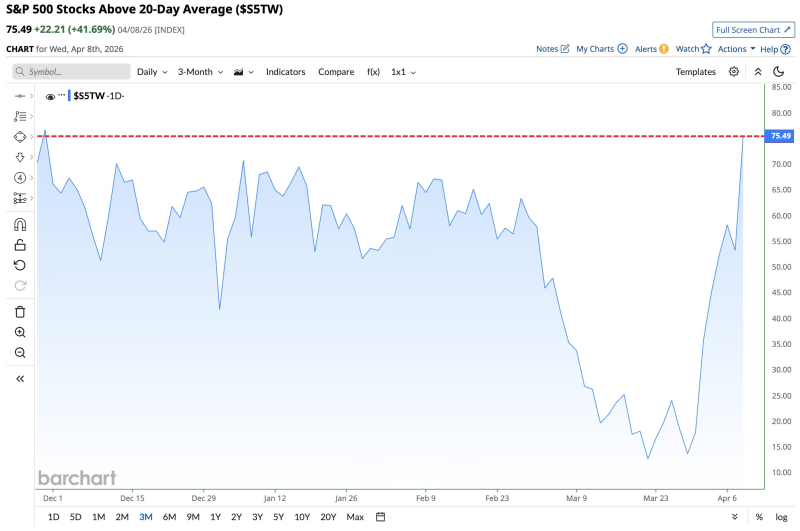
The move, highlighted by Barchart, shows the indicator reaching 75.49 - confirming a rapid expansion in the number of stocks reclaiming their short-term trend after a deeply depressed March.
The Surge That Reversed S&P 500 Participation
The chart shows a sharp rebound in breadth after a deep decline in March, where the percentage of stocks above the 20-day moving average dropped to very low levels before reversing higher. From there, the indicator climbed aggressively, forming a near-vertical move into the mid-70s.
This type of move reflects a synchronized recovery across the index - a large portion of stocks moving back above their 20-day moving average within a short period rather than a narrow advance led by a handful of large-cap names.
A near-vertical move from deeply depressed levels to 75.49% reflects synchronized recovery across the index - not a narrow advance driven by a few large names.
S&P 500 Breadth Drops to 51% - Lowest in 5 Months captured the weakness that preceded this reversal, providing a reference point for just how far breadth has traveled in a short period - and why the speed of the recovery is as notable as the level itself.
Why the S&P 500 75% Breadth Zone Is the Key Test
A dashed horizontal line near the 75% level highlights a clear threshold on the chart. Previous rallies approached this area but did not sustain above it for long - making the current move into that zone a critical test of whether breadth can hold at elevated levels or begins to pull back.
This area acts as a natural ceiling within the recent range, where prior advances have struggled to extend further. The current reading at 75.49 brings the indicator directly into contact with that resistance for the first time since November.
From Extreme S&P 500 Weakness to Strong Participation
The move from the March lows to current levels reflects a dramatic shift in market participation across three clearly defined stages:
- The indicator rebounded from deeply depressed levels
- The rally into the mid-70s occurred rapidly
- The reading now marks the strongest breadth since November
67% of S&P 500 Stocks Now Trade Above 200-Day Moving Average, Strongest Breadth Since August adds context on the longer-term moving average picture, showing that the 20-day breadth recovery is happening alongside improving participation on the 200-day timeframe as well.
S&P 500 Breadth Signal Shows 100% Historical Win Rate reinforces why breadth reversals of this magnitude deserve close attention - historically, moves from extreme lows back above key thresholds have been among the most reliable signals in the S&P 500 dataset.
 Peter Smith