 Eseandre Mordi

Hims & Hers Health has caught the attention of technical traders after HIMS attempted a rebound from a significant support level on the weekly chart. The stock has been trading around $15.82 following a bounce from a horizontal support zone near $13.74 - but the recovery quickly ran out of steam. The stock gave back roughly 4% after Monday's bounce, underscoring just how fragile the current recovery attempt really is.
Sellers Stay in Control as HIMS Slides Toward $13.7
The broader trend for HIMS has been clearly bearish, with multiple lower highs forming across the past several months.
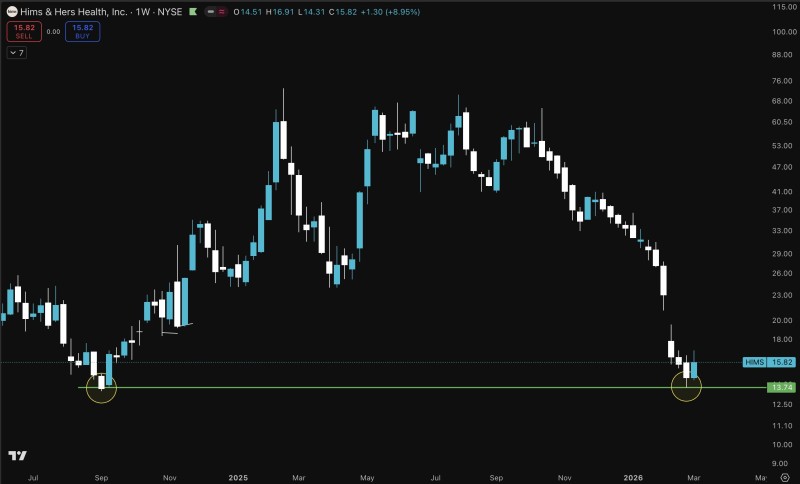
The weekly chart tells a story of persistent selling pressure as the stock drifted into the mid-teens range. HIMS sliding toward the $13.5 support zone as the downtrend deepens has already drawn attention from analysts who highlighted the importance of that level as a potential floor - and the current price action is putting those observations to the test.
Key Support Band Between $13.60 and $15 Could Define Next Move
The $13.7 area has emerged as a critical reference point that could determine HIMS's near-term direction. Earlier work pointed to HIMS stock trading near oversold conditions while testing support between $15 and $13.60, suggesting buyers may attempt to defend the zone if selling pressure begins to ease. Adding further weight to this region, additional analysis noted the stock approaching multi-year support after an extended decline from earlier highs - reinforcing just how historically meaningful the current price zone has become.
With HIMS trading significantly below its previous peak levels, the market is now watching closely to see whether the support band can hold. The behavior around this level over the coming weeks may play an important role in shaping overall sentiment toward Hims & Hers Health - either providing a foundation for a sustained recovery or confirming that the downtrend still has further to go.
 Eseandre Mordi


