Eseandre Mordi

A sudden and aggressive shift in global equity momentum is unfolding, with March shaping up as one of the weakest months in recent years. Global stocks are down 8.56% month-to-date, putting them on track for the worst monthly drop since September 2022 and confirming a decisive breakdown in market structure.
The Breakdown That Shifted the Global Stock Market Trend
The chart shows a volatile sequence of alternating monthly gains and losses since 2021, but the current move stands apart. The latest reading near -8.56% is among the deepest declines in the entire period and mirrors the sharp downside phases seen during prior bear market conditions.
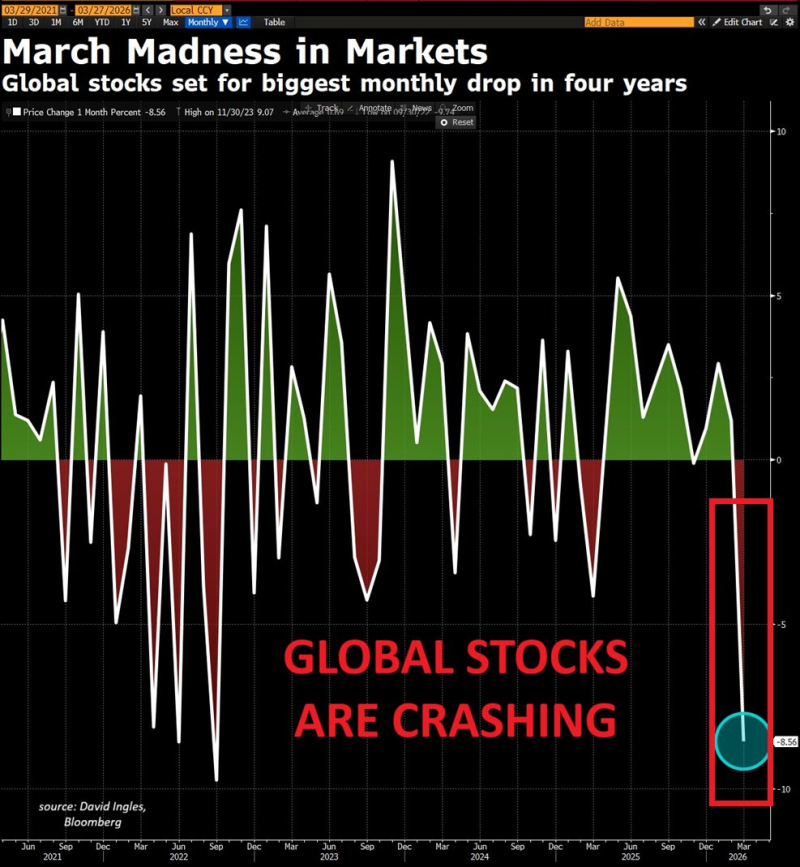
Earlier selloffs often stabilized within the -4% to -6% range, forming a loose downside boundary. This time price action extends well below that zone, signaling a clear loss of support control and a break from prior equilibrium. Recent months show weaker recoveries followed by stronger declines - buying pressure has been fading while sellers gain dominance.
As Global Markets Investor noted, global equities are experiencing one of the most severe monthly drawdowns in recent years, alongside record capital outflows from Asian emerging markets.
Where Momentum Turns Against Stock Market Buyers
Momentum has shifted decisively. Previous periods on the chart were characterized by sharp green spikes reflecting aggressive buying activity. That pattern has now weakened considerably.
The latest move introduces a dominant bearish impulse where downside volatility expands and rebounds fail to establish any meaningful recovery. Key technical observations reinforce this picture:
- Upside momentum becoming inconsistent and short-lived
- Increasing frequency of sharp downside moves
- Current decline exceeding the historical volatility range
This kind of price behavior typically reflects forced selling and a broader repositioning across markets.
MSCI Asia Pacific Index Falls 6.3% as Taiwan Posts $7.9B Record Outflow captures how that repositioning is playing out at the regional level, with Asian emerging markets absorbing some of the heaviest pressure.
Global Equities Enter a More Unstable Market Structure
The magnitude of the decline aligns with prior stress periods and suggests a synchronized unwind across regions. DXY Turns Bullish as Traders Flip to $6.2B Net Long for the First Time in 2026 shows how that rotation is reshaping currency positioning at the same time, adding another layer of pressure to risk assets globally.
The key signal is not just the size of the drop - it is the structural break it represents.
When markets move beyond established downside ranges, they often transition into a more unstable phase where volatility persists and recovery becomes less predictable. S&P 500 Sheds $3.1T in Three Weeks After Hitting October Peak puts a dollar figure on what that instability looks like in practice - and the numbers are difficult to ignore.
When markets move beyond established downside ranges, they often transition into a more unstable phase where volatility persists and recovery becomes less predictable.
For now, the structural break is the dominant signal. Buyers are no longer able to defend previously reliable zones, and that shift alone changes the calculus for anyone still positioned for a near-term recovery.
 Eseandre Mordi