Usman Salis
⬤ The Dow Jones Industrial Average just can't seem to break past 42,850, and that's becoming a real problem. The index tried to climb back above this level after getting knocked down, but it couldn't hold the gains. Even when the market rallied on CPI data, it wasn't enough to push through. This rejection is reinforcing what technical analysts have been warning about - the index might be stuck in what's called an ascending broadening pattern, which basically means volatility is ramping up.
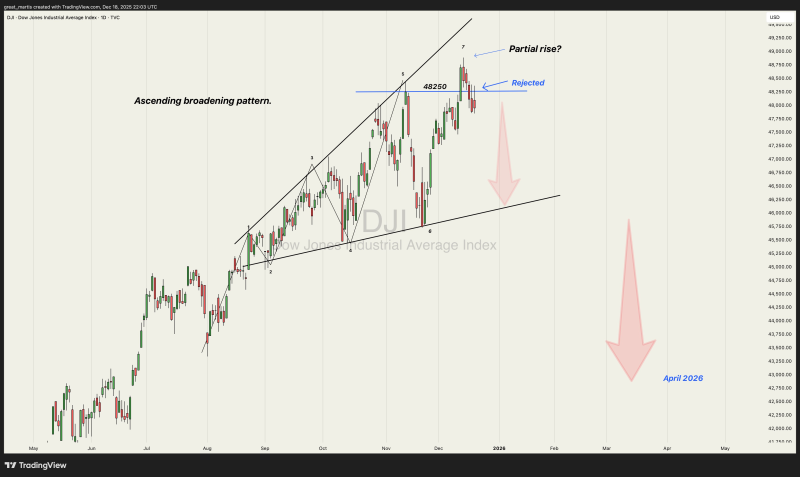
⬤ Looking at the chart, you can see the Dow is caught in this expanding formation where it's making higher highs and lower lows. That's not a good sign. The rejection at 42,850 happened right when buying pressure seemed to fade out. "The inability to reclaim this threshold increases the probability that the broader pattern remains active," highlighting how critical this level has become for near-term direction. As long as the index stays below this resistance, the path of least resistance might actually be down.
⬤ What makes this setup concerning is how the price swings are getting wider. The index keeps bouncing between rising support and resistance lines, but it can't establish any real direction. If this consolidation drags on much longer beneath that 42,850 ceiling, history tells us we could see even bigger price swings stretching into early 2026. Nothing's broken yet, but the longer this goes on, the higher the risk becomes.

⬤ Why does this matter beyond just the Dow? Because when the Dow Jones struggles like this, it usually signals something broader happening across U.S. stocks. If one of the market's main benchmarks can't get past a major resistance level, that tells you momentum is fading and uncertainty is building. Traders are already starting to price in more volatility, which could mean choppier conditions for weeks or even months ahead.
 Usman Salis